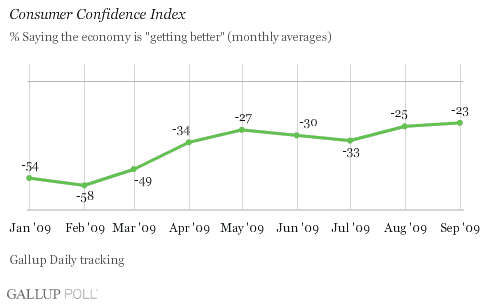
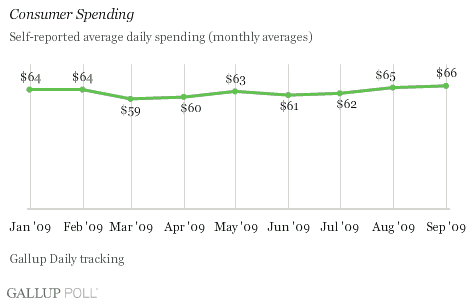
PRINCETON, NJ -- Consumer spending was essentially flat in September, in comparison not only to August but also to the first two months of the year. At the same time, consumer confidence increased to its highest level of 2009, marking a huge improvement since the beginning of the year. Gallup's key economic measures thus continue to confirm that confidence is decoupled from spending and that a new normal for spending has been established.
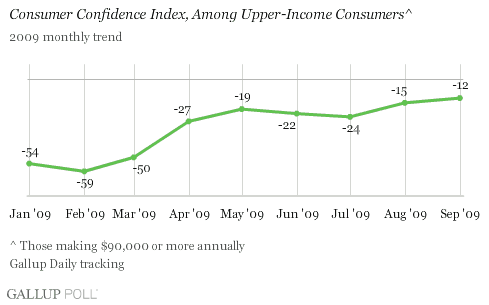
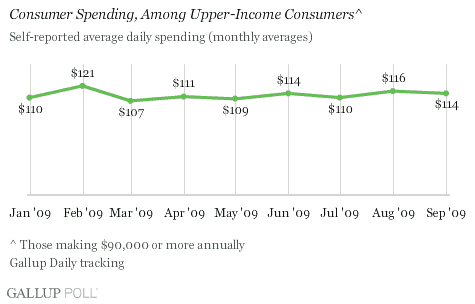
Upper-Income Consumers More Confident, but Spending Remains Flat
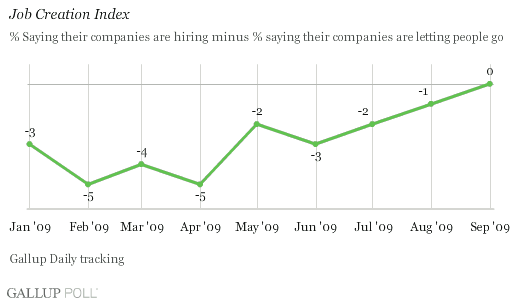
"Gallup's Job Creation Index in September showed its third monthly improvement in a row -- continuing an improving trend since April. Virtually all of this improvement is from a slowdown in layoffs."
Consumer confidence among upper-income Americans (those making at least $90,000 a year) increased in September to a new 2009 high, and is sharply higher than its year-ago level. While upper-income Americans' self-reported average daily spending in stores, restaurants, gas stations, and online is higher than spending of those with other income levels, it has been essentially flat on a monthly basis in 2009, remaining in a tight $14 range. Even with confidence among upper-income consumers increasing by 47 points since February, September spending among this group is down $7 from February.
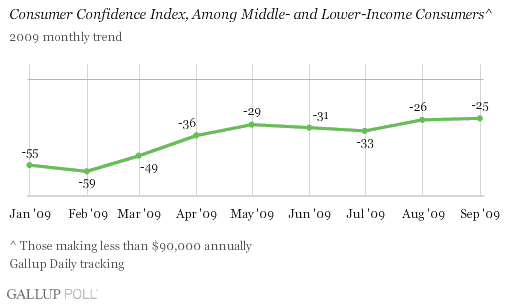
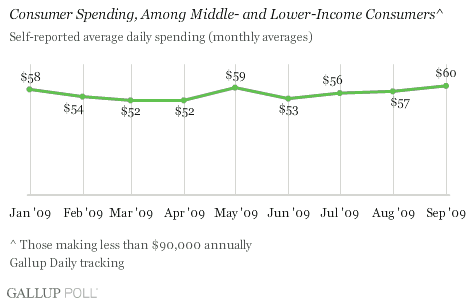
Middle- and Lower-Income Consumers Follow Suit
Consumer confidence among middle- and lower-income Americans (those making less than $90,000 a year) also reached a new 2009 high in September. While this group's confidence is not as high as confidence among the upper-income group, it is up 34 points from February. Middle- and lower-income Americans' self-reported average daily spending has also been essentially flat on a monthly basis in 2009, remaining in a tight $8 range, with September's spending up $6 from February.
Job-Market Layoffs Moderate
Gallup's Job Creation Index in September showed its third monthly improvement in a row -- continuing an improving trend since April. Virtually all of this improvement is from a slowdown in layoffs (28% in April said their companies were letting people go, compared with 24% in September). Over this same period, there is little change in the percentage of employees saying their companies are hiring (23% in April vs. 24% in September). Although reduced layoffs have helped moderate job losses over the past five months, it will take an increase in hiring to produce a significant improvement in job creation and the U.S. unemployment rate.
What to Watch For
As the critical Christmas holiday sales season approaches, all eyes are looking for signs that consumer spending will pick up over the last few months of the year. Probably the most positive finding for those seeking an indicator of better sales is the sharp improvement in consumer confidence, as recorded in Gallup's Consumer Confidence Index. While some have been skeptical of the widely assumed relationship between confidence and spending, Gallup Daily data confirm that this relationship has been effectively decoupled throughout 2009.
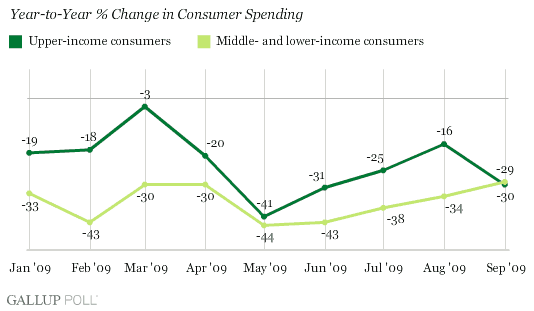
Gallup spending data for the first nine months of 2009 also tend to indicate something of a spending "new normal," particularly with spending remaining flat among upper-income consumers, who generally have the disposable income to spend more freely if they so desire. While the year-over-year changes in consumer spending are somewhat volatile as a result of one-time effects such as the 2008 tax rebates, Gallup finds average daily discretionary consumer spending to be down 30% in September across income levels.
Although a substantial proportion of the 2009 spending decline is likely attributable to the spending new normal, some may also be temporary. In this regard, the job-market situation becomes key to some potential improvement in spending, particularly among middle- and lower-income Americans. Even as Gallup job data show that layoffs are moderating, the lack of new hiring suggests job creation has yet to be realized on Main Street. Therefore, one thing to watch closely in the weeks ahead is job creation -- particularly new hiring.
Another factor to watch is consumer credit. On Wednesday, the Federal Reserve reported that consumer credit fell at an annual rate of 5.8% during August -- the seventh consecutive monthly decline -- and the Fed's data suggest the drop would have been substantially greater if it had not been for the "Cash for Clunkers" program. If consumer credit use continues to decline as consumers rebuild their personal balance sheets, this will tend to reinforce current spending levels as the new normal.
Finally, probably the most important thing to watch involves year-over-year spending comparables. The National Retail Federation (NRF) reports that last year's holiday sales fell 3.4% from 2007 -- the first drop since it began tracking the measure in 1995. The question is whether the lower spending levels during the fourth quarter of 2008 already reflected the spending new normal for the Christmas season. The NRF is forecasting a 1% decline in holiday sales in 2009, which would mark the second consecutive yearly holiday decline.
Gallup's behaviorally based consumer spending data are now running consistently below last year's monthly spending for all income levels. This gap in year-over-year spending will need to begin closing rapidly as last year's comparables become easier to match, or the NRF forecast for 2009 holiday sales may end up being optimistic. In turn, this could mean sales and profit challenges for the nation's retailers this Christmas season.
Survey Methods
For Gallup Poll Daily tracking, Gallup interviews approximately 1,000 national adults, aged 18 and older, each day. The Gallup consumer perceptions of the economy and consumer spending results are based on random half-samples of approximately 500 national adults, aged 18 and older, each day. The Gallup job creation and job loss results are based on a random half sample of approximately 250 current full- and part-time employees each day. Results for September 2009 are based on telephone interviews with more than 13,000 adults for the Consumer Confidence Index and the Consumer Spending measure. September results for the Job Creation Index are based on interviews with more than 7,000 employees. For all of these results, one can say with 95% confidence that the maximum margin of sampling error is ±1 percentage point.
Interviews are conducted with respondents on land-line telephones and cellular phones.
In addition to sampling error, question wording and practical difficulties in conducting surveys can introduce error or bias into the findings of public opinion polls.
Polls conducted entirely in one day, such as this one, are subject to additional error or bias not found in polls conducted over several days.