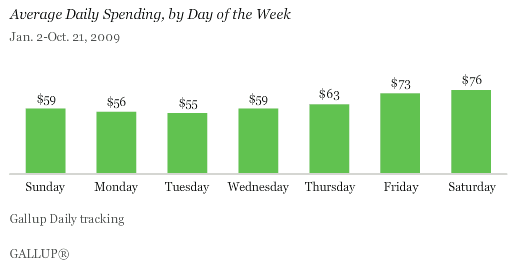
PRINCETON, NJ -- Gallup's Daily monitoring of consumers' self-reported average daily spending in stores, restaurants, gas stations, and online finds that Americans spend the most on Saturdays, followed closely by Fridays; they spend the least on Mondays and Tuesdays.
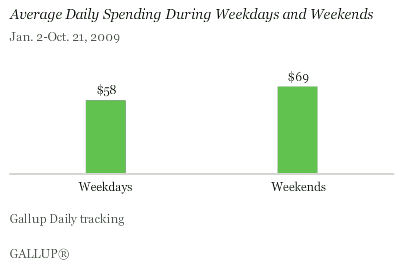
As a result, weekend (Friday through Sunday) spending on an average daily basis far exceeds weekday spending. In part, this may result from current American lifestyles, with weekday demands leaving little time for shopping or entertainment outside the home. The findings are based on aggregated Gallup Daily tracking data from Jan. 2 to Oct. 21, 2009.
Paycheck Effect
"Average daily spending has changed by $10 or more from week to week during most weeks since early August, with increases generally occurring in the weeks containing the first and midpoint days of each month, and declines in the other weeks."
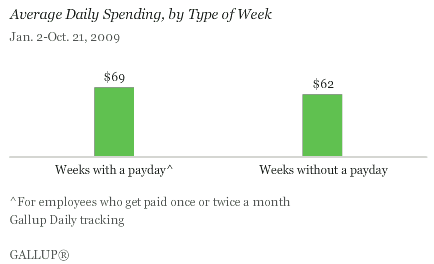
Further, there appears to be a "paycheck effect," with spending during typical payday weeks (around the beginning and the middle of each month, for those who are paid once or twice a month) significantly higher than that during weeks without a payday. For the most part, this may reflect the fact that many Americans who are paid on a semi-monthly or monthly basis -- like many who are paid weekly -- still live paycheck to paycheck. However, this situation may be intensified in the current economic climate as Americans make fewer shopping trips, buy relatively more when they do shop, and purchase more necessities and fewer impulse items.
This pattern has been especially evident in recent weeks. Average daily spending has changed by $10 or more from week to week during most weeks since early August, with increases generally occurring in the weeks containing the first and midpoint days of each month, and declines in the other weeks. Again, this may be the result of the factors noted earlier, or, alternatively, the possibility that many consumers simply feel more confident about spending when they have a greater amount of cash on hand and are less comfortable using credit.
Spending Differs by Gender and Age
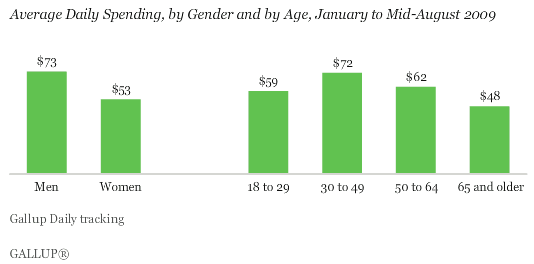
Men report spending more on average than women do, which may be a reflection of the fact that men have higher average incomes than women (Gallup analysis shows income to be the greatest predictor of spending). Similarly, Americans aged 30 to 49 -- typically a time when people have growing families -- tend to spend the most, while Americans 65 or older tend to spend the least. Indeed, those with children under 18 spend significantly more on average than those without young children.
Commentary
Over the past several months, consumer spending patterns appear to be changing. Gallup Daily results show that the "paycheck effect" seems to be intensifying as consumers spend more during the weeks when they are paid and less during other weeks.
At first, it seemed as though this might have been a sign that consumers were trying to break out of the "new normal." Perhaps consumer spending would follow economic confidence and begin to find an upward path. In turn, this would confirm that the end of the recession and the beginning of recovery was beginning to be felt on Main Street.
Instead, monthly averaging of today's consumer spending shows almost no change since January. The new normal level of spending is fully intact even as confidence improves and job layoffs seem to be easing compared to earlier in the year.
As noted earlier, this new intensified, paycheck-oriented spending pattern may be the result of a new shopping pattern, with consumers making fewer trips but buying more on each trip. Or it may be that consumers are just more comfortable shopping when they have cash. Or perhaps this is a reflection of the reduced willingness of consumers to use credit, their reduced desire to take on credit-card debt, or simply a lack of credit availability. Regardless, it appears that there may be a new "cash-based" consumer spending pattern developing.
This could have significant implications for how retailers price and time their sales; how they handle their merchandising; and how they evaluate their inventories. It could also be an interesting Christmas for everyone if it is more "cash-based" than "credit-based" this year.
Right now, Gallup's consumer spending data continue to show consumers spending roughly 30% less than they did during the same week a year ago across income groups -- another possible sign of a more "cash-based" spending pattern. Unless this pattern changes, it is hard to see much cheer for retailers at Christmas or much improvement in jobs or the Main Street economy as the year ends.
Gallup's new behavioral economics-based Consumer Spending measure will be first to indicate whether this potential new consumer spending pattern persists in the weeks ahead.
Survey Methods
For Gallup Daily tracking, Gallup interviews approximately 1,000 national adults, aged 18 and older, each day. The Gallup consumer spending results are based on random half-samples of approximately 500 national adults, aged 18 and older, each day. For purposes of this analysis, a total of 140,114 interview results were compiled over the period of Jan. 2 to Oct. 21, 2009. Samples for individual days of the week totaled more than 19,000 completed interviews while those for weekdays totaled 80,230 and those weekends totaled 59,884. For all of these samples, one can say with 95% confidence that the maximum margin of sampling error is ±1 percentage point.
Interviews are conducted with respondents on land-line telephones and cellular phones.
In addition to sampling error, question wording and practical difficulties in conducting surveys can introduce error or bias into the findings of public opinion polls.
