GALLUP NEWS SERVICE
PRINCETON, NJ -- A recent Gallup Poll finds evidence that an increasing number of Americans are to some degree practicing the principles of the controversial Atkins diet. The diet, popularized by the late Dr. Robert Atkins, instructs its followers to avoid foods that contain carbohydrates and to eat foods high in protein and fat. According the poll, conducted July 8-11, more Americans today say they "actively try to avoid" carbohydrates and foods that have a lot of "carbs" -- such as bread and soda or pop -- than said so in 2002. But at the same time, there has been little change in the percentage of Americans eating fat and foods that contain fat. Even with this apparent change in eating habits, Americans by a wide margin continue to say that a diet low in fat is more beneficial to the average American than one low in carbohydrates.
Supporters of the Atkins dieting approach argue it is a way both to lose a lot of weight in a relatively short amount of time and to maintain a healthy body weight in the long term by limiting excess carbohydrates that the body transforms into fat. Opponents counter that there is no magic in the diet other than the formula of most successful diets, namely, limiting calorie intake. They also raise concerns about an unbalanced diet tilted heavily toward foods that tend to be high in fat, which may promote heart disease, the leading cause of death in the United States.
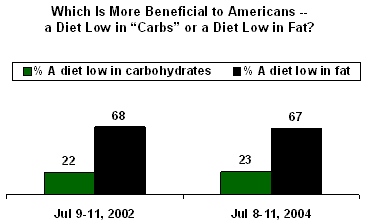
By a nearly 3-to-1 margin, the poll shows Americans believe a diet low in fat (67%) is more beneficial to the average American than one low in carbohydrates (23%). Views on this matter have remained constant over the past two years -- a 2002 Gallup Poll found 68% of Americans saying a low-fat diet was better, while 22% said a low-carbohydrate diet. This view is held uniformly among all key demographic subgroups.

Nevertheless, the poll shows evidence that an increasing percentage of Americans are shying away from foods high in carbohydrates in their diets.
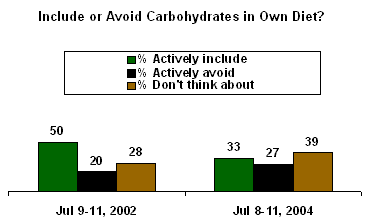
In 2002, 50% of Americans said they "actively tried to include" carbohydrates in their diets, 20% said "they actively tried to avoid" them, and 28% said they did not think about it either way. Now, the percentage who say they try to include carbohydrates has dropped sharply to 33%, while the percentage who say they avoid them has increased to 27%, and 39% now say they don't think about their carbohydrate intake.

There has been an increase among all age groups in the percentage of Americans actively trying to avoid carbohydrates, but the largest has come among people between the ages of 50 and 64. Thirty-nine percent of those in the 50-64 age group are now actively trying to avoid carbohydrates, compared with 25% who said that in 2002, an increase of 14 percentage points. In the other age groups, the increase has been between 4 and 6 points.
|
Change in Consumption of Carbohydrates in Diet, By Age |
|||
|
Age group |
% Avoid, 2002 |
% Avoid, 2004 |
Change |
|
|
|
|
|
|
18-29 |
15 |
19 |
+4 |
|
30-49 |
18 |
24 |
+6 |
|
50-64 |
25 |
39 |
+14 |
|
65 and older |
22 |
27 |
+5 |
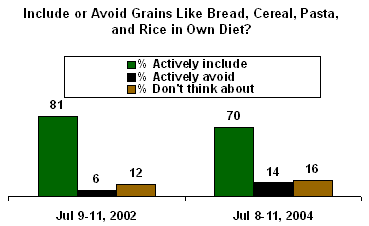
There has been a more modest decline in the percentage of Americans who actively try to include "grains, such as bread, cereal, pasta, and rice." In 2002, 81% said they actively tried to include such foods in their diets and only 6% tried to avoid them. Now, 70% try to include them and the percentage who avoid them has more than doubled, to 14%.

Evidence of Atkins-inspired diet change is also apparent in the increasing proportion of Americans who say they try to avoid "soda or pop" (51%, up from 41% in 2002) and sugar (51%, compared with 43% in 2002).
In addition, Gallup finds a decline in the percentage of alcohol consumers who say they drink beer (most beers tend to be high in carbohydrates). Thirty-nine percent of drinkers say they most often drink beer, the lowest percentage since Gallup began tracking this in 1992. In the early 1990s, nearly half of drinkers said beer was their drink of choice.
Avoiding carbohydrates is one part of the Atkins diet equation, while another involves a diet heavily tilted toward foods high in fat content (according to Atkins theory, the key to weight loss is getting one's body to burn fat rather than carbohydrates for energy). The poll finds little evidence that more Americans are adhering to this part of the diet. Since 2002, there has been little or no change in Americans' attitudes toward the following foods in their diets: beef, chicken, dairy products, fat, and fish -- all key components of the Atkins diet. For example, the percentage who say they actively try to include "fat" in their diet is 14%, compared with 16% in 2002.
The following tables summarize the changes in Americans' eating habits between 2002 and 2004. The greatest changes have come in the public's consumption of foods rich in carbohydrates. There has been relatively little change in the public's consumption of fruits, vegetables, chicken, and beef.
|
Foods Americans Try to Include in their Diets |
|||
|
Food |
% Actively Include, 2002 |
% Actively Include, 2004 |
Change |
|
|
|
|
|
|
Chicken/poultry |
84 |
85 |
+1 |
|
Fruits |
89 |
89 |
0 |
|
Beef/red meat |
60 |
59 |
-1 |
|
Vegetables |
91 |
90 |
-1 |
|
Fat |
16 |
14 |
-2 |
|
Dairy products |
70 |
67 |
-3 |
|
Salt |
27 |
23 |
-4 |
|
Fish/seafood |
76 |
71 |
-5 |
|
Sugar |
29 |
21 |
-8 |
|
Grains/breads/cereals |
81 |
70 |
-11 |
|
Soda or pop |
36 |
25 |
-11 |
|
Carbohydrates |
50 |
33 |
-17 |
|
Foods Americans Try to Avoid in their
Diets |
|||
|
Food |
% Actively Avoid, |
% Actively Avoid, |
Change |
|
|
|
|
|
|
Soda or pop |
41 |
51 |
+10 |
|
Sugar |
43 |
51 |
+8 |
|
Grains/breads/cereals |
6 |
14 |
+8 |
|
Carbohydrates |
20 |
27 |
+7 |
|
Salt |
45 |
47 |
+2 |
|
Fat |
62 |
64 |
+2 |
|
Fish/seafood |
10 |
11 |
+1 |
|
Dairy products |
13 |
14 |
+1 |
|
Fruits |
2 |
2 |
0 |
|
Vegetables |
2 |
2 |
0 |
|
Chicken/poultry |
5 |
3 |
-2 |
|
Beef/red meat |
23 |
20 |
-3 |
Overall, as was the case in 2002, Americans are most likely to say they actively try to include vegetables (90%), fruits (89%), and chicken and other poultry (85%) in their diets. They are most likely to say they try to avoid fat (64%), sugar (51%), and soda or pop (51%).
The data also reveal some differences in diet choices by Americans' perceptions of their own weight. People who describe themselves as overweight are more likely than those who do not describe themselves that way to say they are avoiding carbohydrates (32% versus 23%, respectively), grains (17% versus 11%), and sugar (54% versus 47%).
Survey Methods
These results are based on telephone interviews with a randomly selected national sample of 1,005 adults, aged 18 and older, conducted July 8-11, 2004. For results based on this sample, one can say with 95% confidence that the maximum error attributable to sampling and other random effects is ±3 percentage points. In addition to sampling error, question wording and practical difficulties in conducting surveys can introduce error or bias into the findings of public opinion polls.
34. From a health perspective, which of the following do you think is more beneficial for the average American -- [ROTATED: a diet low in fat, (or) a diet low in carbohydrates]?
|
|
|
|
|
|
MEDICAL EVIDENCE UNCLEAR (vol.) |
|
|
|
|
|
|
|
|
|
|
2004 Jul 8-11 |
67% |
23 |
5 |
2 |
* |
3 |
|
|
|
|
|
|
|
|
|
2002 Jul 9-11 |
68% |
22 |
5 |
1 |
1 |
3 |
|
(vol.) Volunteered response |
||||||
|
* Less than 0.5% |
||||||
35. Thinking about the food you eat, for each of the following please say if it is something you actively try to include in your diet, something you actively try to avoid, or something you don't think about either way. How about -- [RANDOM ORDER]?
A. Beef and other red meat
|
|
|
|
Don't think about |
No |
|
|
|
|
|
|
|
2004 Jul 8-11 |
59% |
20 |
21 |
* |
|
|
|
|
|
|
|
2002 Jul 9-11 |
60% |
23 |
17 |
* |
B. Carbohydrates
|
|
|
|
Don't think about |
No |
|
|
|
|
|
|
|
2004 Jul 8-11 |
33% |
27 |
39 |
1 |
|
|
|
|
|
|
|
2002 Jul 9-11 |
50% |
20 |
28 |
2 |
C. Chicken and other poultry
|
|
|
|
Don't think about |
No |
|
|
|
|
|
|
|
2004 Jul 8-11 |
85% |
3 |
12 |
* |
|
|
|
|
|
|
|
2002 Jul 9-11 |
84% |
5 |
11 |
* |
D. Dairy products
|
|
|
|
Don't think about |
No |
|
|
|
|
|
|
|
2004 Jul 8-11 |
67% |
14 |
19 |
* |
|
|
|
|
|
|
|
2002 Jul 9-11 |
70% |
13 |
16 |
1 |
E. Fat
|
|
|
|
Don't think about |
No |
|
|
|
|
|
|
|
2004 Jul 8-11 |
14% |
64 |
21 |
1 |
|
|
|
|
|
|
|
2002 Jul 9-11 |
16% |
62 |
21 |
1 |
F. Fish and other seafood
|
|
|
|
Don't think about |
No |
|
|
|
|
|
|
|
2004 Jul 8-11 |
71% |
11 |
18 |
* |
|
|
|
|
|
|
|
2002 Jul 9-11 |
76% |
10 |
14 |
* |
G. Fruits
|
|
|
|
Don't think about |
No |
|
|
|
|
|
|
|
2004 Jul 8-11 |
89% |
2 |
9 |
* |
|
|
|
|
|
|
|
2002 Jul 9-11 |
89% |
2 |
9 |
* |
H. Grains such as bread, cereal, pasta and rice
|
|
|
|
Don't think about |
No |
|
|
|
|
|
|
|
2004 Jul 8-11 |
70% |
14 |
16 |
* |
|
|
|
|
|
|
|
2002 Jul 9-11 |
81% |
6 |
12 |
1 |
I. Salt
|
|
|
|
Don't think about |
No |
|
|
|
|
|
|
|
2004 Jul 8-11 |
23% |
47 |
30 |
* |
|
|
|
|
|
|
|
2002 Jul 9-11 |
27% |
45 |
28 |
* |
J. Soda or pop
|
|
|
|
Don't think about |
No |
|
|
|
|
|
|
|
2004 Jul 8-11 |
25% |
51 |
24 |
* |
|
|
|
|
|
|
|
2002 Jul 9-11 |
36% |
41 |
23 |
* |
K. Sugar
|
|
|
|
Don't think about |
No |
|
|
|
|
|
|
|
2004 Jul 8-11 |
21% |
51 |
28 |
* |
|
|
|
|
|
|
|
2002 Jul 9-11 |
29% |
43 |
27 |
1 |
L. Vegetables
|
|
|
|
Don't think about |
No |
|
|
|
|
|
|
|
2004 Jul 8-11 |
90% |
2 |
8 |
* |
|
|
|
|
|
|
|
2002 Jul 9-11 |
91% |
2 |
7 |
* |
|
* Less than 0.5% |
||||
SUMMARY TABLE: FOOD INCLUDED/AVOIDED IN ONE'S DIET
|
2004 Jul 8-11 |
|
|
Don't think about |
|
|
% |
% |
% |
|
Vegetables |
90 |
2 |
8 |
|
Fruits |
89 |
2 |
9 |
|
Chicken and other poultry |
85 |
3 |
12 |
|
Fish and other seafood |
71 |
11 |
18 |
|
Grains such as bread, cereal, pasta and rice |
70 |
14 |
16 |
|
Dairy products |
67 |
14 |
19 |
|
Beef and other red meat |
59 |
20 |
21 |
|
Carbohydrates |
33 |
27 |
39 |
|
Soda or pop |
25 |
51 |
24 |
|
Salt |
23 |
47 |
30 |
|
Sugar |
21 |
51 |
28 |
|
Fat |
14 |
64 |
21 |
