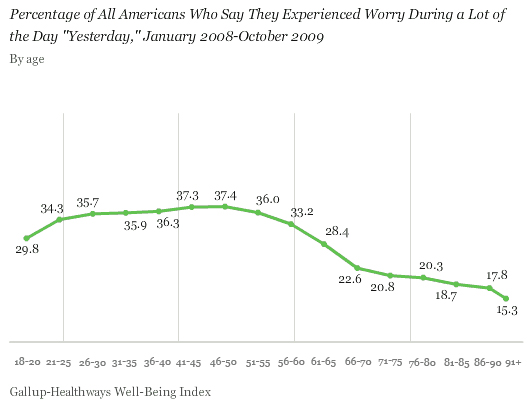
PRINCETON, NJ -- A new analysis of more than 650,000 Gallup-Healthways Well-Being Index interviews conducted in 2008 and 2009 shows that "worry" is a much more common emotion among young and middle-aged Americans than among seniors. Well over a third (37%) of those in their 40s report having experienced worry "a lot of the day yesterday." This figure drops to about 23% among those in their late 60s and drops further to 15% among those aged 91 and older.
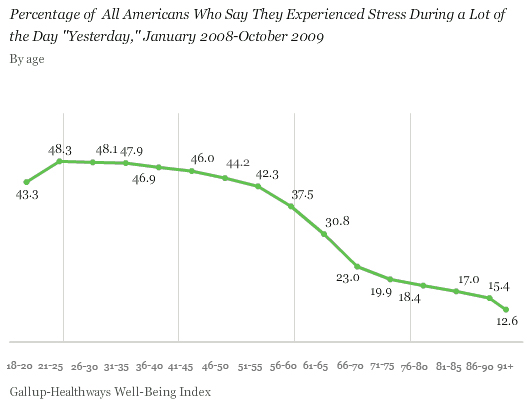
Similar Pattern for Stress
"At every age, women are at least slightly more likely than men to report having experienced worry or stress the day before the interview."
A similar age-related pattern occurs for reports of stress. Almost half of those in their early 20s (48%) report having experienced stress a lot of the day prior to the interview. Stress begins to drop off significantly as Americans reach their mid- to late 50s, and drops to 13% among those aged 91 or older.
An analysis of a number of correlates of worry and stress does not provide a direct explanation for the drop-off in these emotions as age increases.
Women More Likely Than Men to Worry at All Ages
The American population becomes proportionately more female as it ages. In these data, 52% of those aged 21 to 25 are male. This figure drops to 47% among those aged 61 to 65 and to 34% of those aged 91 and older. If men were more likely than women to worry or be stressed, then some of the explanation for the age-to-worry (and age-to-stress) relationship could be the female skew in the older age ranges.
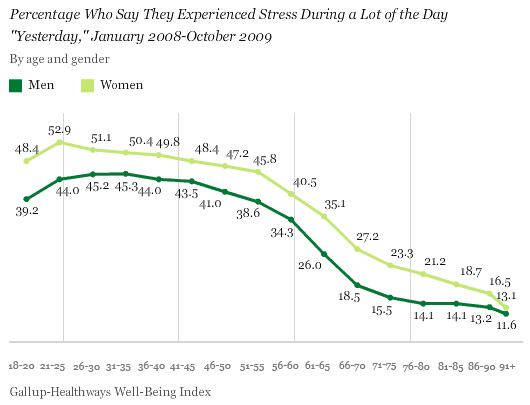
However, men are not more likely than women to worry or be stressed. Just the opposite is true. There is a significant gender gap in terms of both worry and stress. At every age, women are at least slightly more likely than men to report having experienced worry or stress the day before the interview. The pattern is fairly uniform, with a 5- to 10-point gap across the age spectrum until Americans reach their 80s, when the gap narrows.
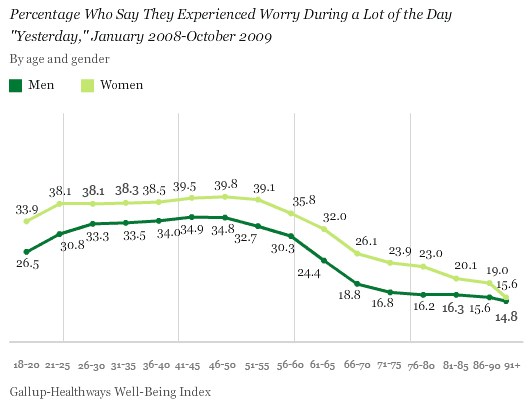
It thus does not appear that gender is part of the explanation for the age-worry/stress relationship.
Children in the Home Not a Major Source of Worry
A demographic fact that theoretically might help explain the drop-off in worry/stress by age is whether one has children. The percentage of individuals who report having a child under 18 in the household drops precipitously by the time Americans are in their 50s (and many of the small percentage of Americans aged 60 and up who report having children in the home may well be reporting grandchildren).
There is a basic relationship between having children in the home and experiencing worry or stress. Americans with a child in the home are more likely to report worry and stress than are those who don't have a child in the home, with even greater differences in terms of reported stress.
In general, then, younger Americans are the most likely to have children in the home, and having a child in the home is related to more worry and stress. These relationships of course do not prove that it is children per se that cause worry and stress, only that there is an interrelationship among younger age and children and worry/stress.
To help disentangle these patterns, the accompanying graphs display worry and stress by age among those with children in the home and among those without.
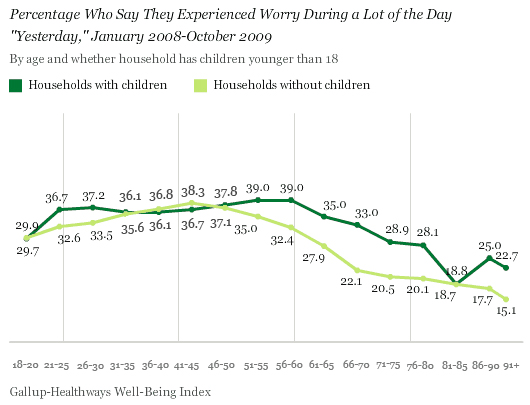
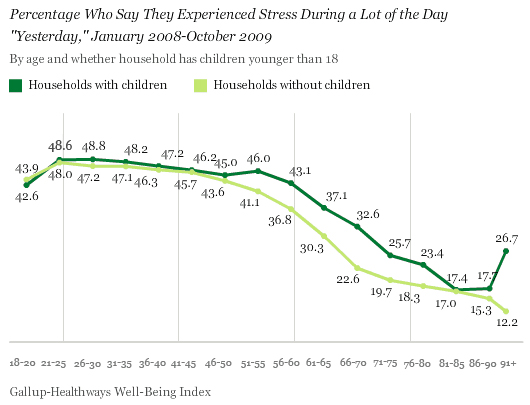
The data show the same basic relational pattern between worry/stress and age among Americans who do not have a child in the home and among those who do. Younger Americans without children worry more and have more stress than older Americans without children. In fact, even young adults without children worry more and report more stress than older adults with children in the home. Younger Americans with children in the home worry more and have more stress than older Americans with children in the home.
Also, the gap in worry and stress between those with children in the home and those without is very small among younger Americans. Overall, the average worry percentage is 36% among those aged 50 and younger with children in the home and 35% among those aged 50 and younger without children in the home. For stress, the difference is also only one percentage point, 47% versus 46%, respectively. It is apparent that the higher levels of worry among younger Americans occur regardless of whether they have children in the home. It appears that the age-worry or age-stress relationship is not simply owing to the fact that younger people generally have children in the home and older people generally do not.
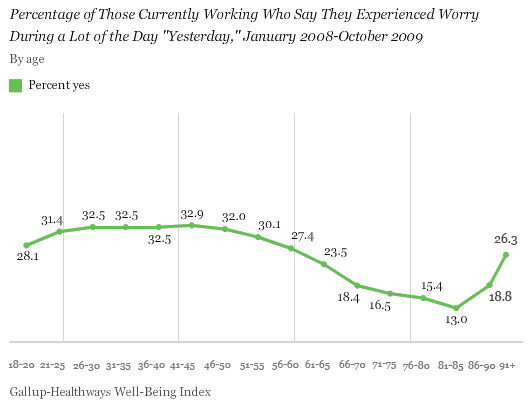
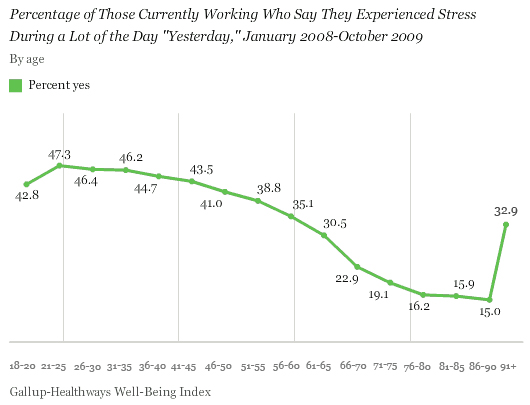
Even Among Employed, Worry and Stress Drop Off With Age
Taken as a whole, Americans of all ages who are employed worry less and have less stress than Americans who are not employed.
Any analysis of the correlates of not being employed is complex, since there are many reasons people are unemployed. For some, unemployment is by choice -- homemakers, those who are retired -- while for others it is negatively forced on them, particularly those who are unemployed and looking for work. Still, for whatever reasons, in America today there is a significant association between being employed and less worry and stress. So it does not appear that the fact that older Americans are less likely to be employed is a valid explanation for their decrease in worry.
The accompanying graphs show the degree of worry and stress just among employed Americans. The basic pattern of a drop-off in the percentage of Americans exhibiting these two traits as age increases is clearly evident even among this employed group.
No Impact of Religion on Worry and Stress
Older Americans are more religious than younger Americans. Could the relatively low levels of worry among those who are older be due to the calming effect of their relatively higher religiosity?
This does not appear to be the case. Thirty-two percent of more religious Americans (those for whom religion is important in their daily lives) and 33% of nonreligious Americans report having worried yesterday. The comparable values for stress are 38% and 42%, respectively. These differences are too small to explain the age effect.
Cohort vs. Generational Effect
The data reported here reflect a cross-section of the American adult population at a particular point in time -- January 2008 to October 2009 -- and thus do not allow strong inferences to be made about the "normal" course of life events. The worry levels of the respondents included in this analysis are a combination of the life circumstances into which they were born and through which they have lived, as well as generational circumstances that affect individuals at their current ages. Thus, it is not possible with these data to determine the degree to which lack of stress and worry is a result of an individual's life history and experiences versus the individual's current circumstances (including health, family situation, and economic situation).
Given the cross-sectional nature of these data, it is not possible to determine whether these same stress- and worry-by-age patterns will persist in the years ahead. It is possible, for example, that specific life circumstances of the core baby-boom group now in their 50s will stay with them throughout their lives, and that they will not in the years ahead enjoy the decreased stress and worry levels now apparent among those who are in their 60s and older today.
Summary
Americans report a significantly lower incidence of worry and stress as they get older, particularly as they move into and beyond their mid-60s. This finding runs counter to the hypothesis that those who are older would be more apt to worry about deteriorating health, fixed incomes, or impending death. On the other hand, many seniors are beyond the point where they have to worry about varying income, and previous research has shown that seniors are the only age group satisfied with the amount of time they have to enjoy life.
These cross-sectional data do not allow for a determination of whether the worry-age phenomenon reflects a cohort effect (reflecting the particular history and life experiences of those who are older today) or a generational effect (such that past and future generations of Americans would be found to exhibit the same patterns of worry and stress). The analysis does suggest, however, that several logical reasons for older Americans' worrying less -- including that they are much less likely to have children in the home or to be employed, or that they are more religious and more likely to be female -- do not appear to be explanations.
Whatever the reasons, the data would appear to present good news for relatively younger Americans -- particularly the very large population segment of baby boomers. Approaching on the horizon for these Americans is the distinct possibility that day-to-day worry and stress may well subside rather than increase as time goes on.
Survey Methods
Results are based on telephone interviews with more than 650,000 national adults, aged 18 and older, conducted Jan. 2, 2008-Oct. 31, 2009. For results based on the total sample of national adults, one can say with 95% confidence that the maximum margin of sampling error is less than ±1 percentage point. Sample sizes in the groups based on age range from a maximum of 72,238 respondents aged 56 to 60 to a minimum of 2,877 respondents aged 91 and older. The oldest group was thus the smallest group for all further divisions. Only 933 of the 2,877 oldest respondents are male, yielding a margin of error of ±4 percentage points for this subgroup. The largest margin of error is ±9 percentage points for the 122 respondents aged 91 and older who are currently working. Most other groups are dramatically larger than these groups. For example, there are 48,435 respondents in the 51-55 year age group who are currently working, which yields a maximum margin of error of less than ±1 percentage point.
Interviews are conducted with respondents on land-line telephones (for respondents with a land-line telephone) and cellular phones (for respondents who are cell-phone only and cell-phone mostly).
In addition to sampling error, question wording and practical difficulties in conducting surveys can introduce error or bias into the findings of public opinion polls.
