Since 1936, Gallup has been asking Americans, "Are you in favor of the death penalty for a person convicted of murder?" The percentage of Americans in favor of the death penalty has fluctuated significantly over the years, ranging from a low of 42% in 1966, during a revival of the anti-death penalty movement, to a high of 80% in 1994. More recently, public opinion on the death penalty has been more stable, with upward of two in three Americans supporting it.
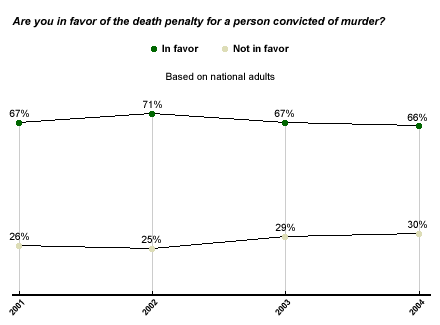
Gallup has asked Americans this question at least twice a year since 2001. To examine responses to this question more closely, Gallup combined the results of the nine surveys that asked this question from 2001 through 2004 on a year-by-year basis*. Overall, the data show that 67% of Americans supported the death penalty for convicted murderers in 2001. This percentage increased slightly to 71% in 2002, before dropping back to 67% in 2003. Results for this year show essentially no change since last year.
Politics and Capital Punishment
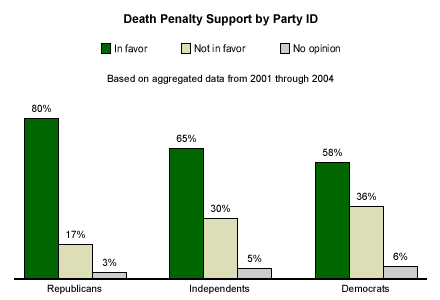
Republicans' and Democrats' opinions on the death penalty differ, although a majority in both groups endorses it. Eighty percent of Republicans support the death penalty, while 65% of independents and 58% of Democrats support it.
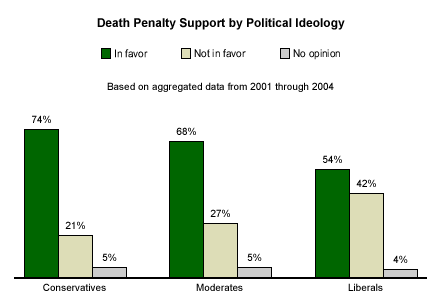
Americans who identify themselves as political conservatives are also more likely to support the death penalty than are moderates or liberals. Nearly three in four conservatives (74%) support capital punishment, compared with 68% of moderates and 54% of liberals.
Men vs. Women on the Death Penalty
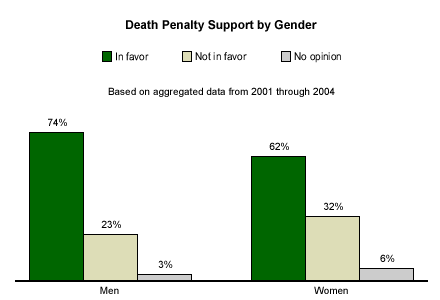
Although a majority of both men and women support the death penalty, men are much more likely to do so than are women. More than 7 in 10 men (74%) support the death penalty, compared with 62% of women.
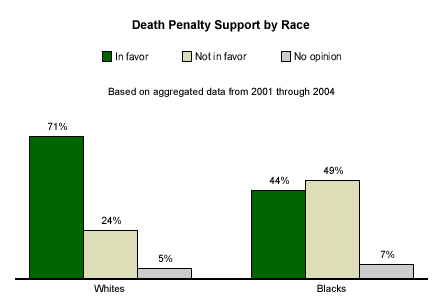
Racial Differences on Death Penalty Support
There are substantial differences between whites and blacks in their support for capital punishment. The data show that 71% of whites support the death penalty, compared with only 44% of blacks. This stark difference may be the result of the ongoing debate about the overrepresentation of blacks on death rows across the country. The Bureau of Justice Statistics reports that there were 3,374 prisoners on death row in 2003, of which 1,418 were black and 1,878 were white. Blacks represent 42% of the inmates on death row, but only 12% of the nation's population.
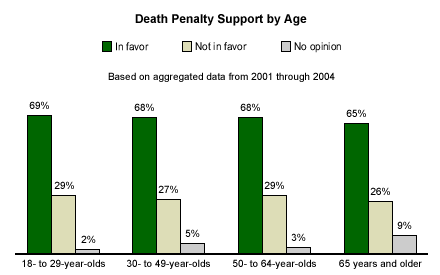
Views of the Death Penalty by Age
The aggregate shows only slight variations in death penalty support by age.
Religion and Death Penalty Support
The combined aggregate results from the nine surveys conducted from 2001 through 2004 show some interesting, albeit subtle, differences in death penalty support by religiosity.
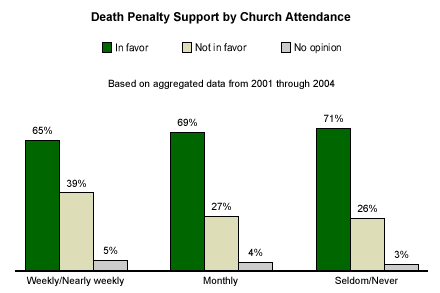
Church Attendance
Americans who attend religious services on a regular basis are slightly less likely to support the death penalty than those who attend less frequently. Although a majority of frequent and infrequent churchgoers support the death penalty, the data show that 65% of those who attend services weekly or nearly weekly favor capital punishment, compared with 69% of those who attend services monthly and 71% of those who seldom or never attend.
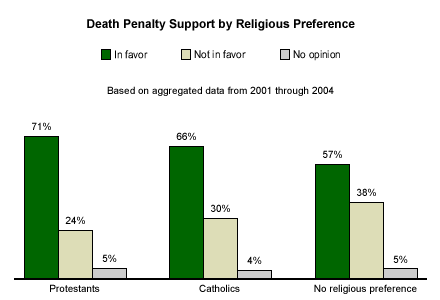
Religious Preference
Protestants are somewhat more likely to endorse capital punishment than are Catholics and far more likely than those with no religious preference. More than 7 in 10 Protestants (71%) support the death penalty, while 66% of Catholics support it. Fifty-seven percent of those with no religious preference favor the death penalty for murder.
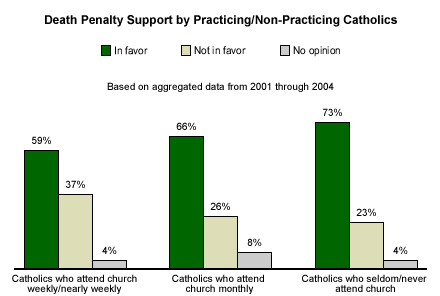
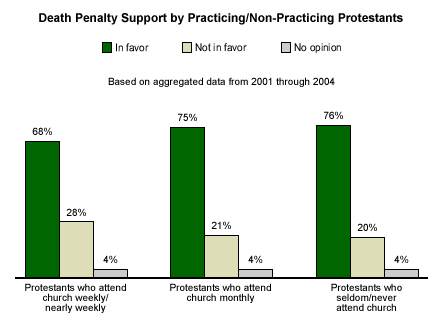
Practicing vs. Non-Practicing
Practicing Catholics, or those who attend church on a weekly or near weekly basis, are less likely to support capital punishment than are non-practicing Catholics (those who attend services rarely or never). Fewer than 6 in 10 practicing Catholics (59%) support the death penalty. This compares with 73% of non-practicing Catholics who support it. This result suggests that practicing Catholics are more likely to adhere to the Catholic Church's anti-death penalty position.
The data also show a similar difference between practicing and non-practicing Protestants in their support for capital punishment, although not to the extent found among Catholics. Sixty-eight percent of practicing Protestants support the death penalty, compared with roughly three in four Protestants who attend church less frequently.
*Results are based on telephone interviews with 6,498 national adults, aged 18 and older, conducted Feb. 19-21, 2001; May 10-14, 2001; Oct. 11-14, 2001; May 6-9, 2002; Oct. 14-17, 2002; May 5-7, 2003; Oct 6-9, 2003; May 2-4, 2004; and Oct. 11-14, 2004. For results based on the total sample of national adults, one can say with 95% confidence that the maximum margin of sampling error is ±2 percentage points.
