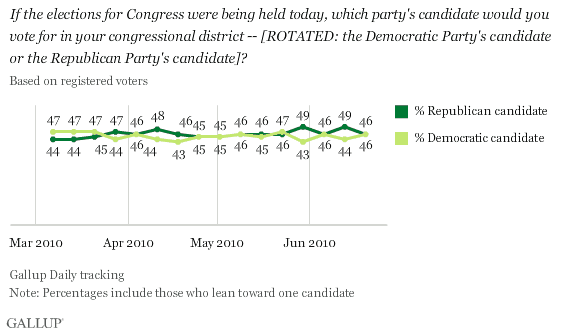
PRINCETON, NJ -- Registered voters divide evenly when asked which party's candidate they would vote for if the congressional elections were held today, with 46% preferring the Republican candidate and 46% the Democratic candidate. Registered voters' preferences have generally been closely divided since Gallup began tracking preferences in March.
Gallup tracks U.S. House voting preferences using the generic ballot for Congress. The generic ballot has proven an accurate predictor of the actual vote for the U.S. House in midterm elections. The latest results are based on interviews with U.S. registered voters conducted June 14-20 on the Gallup Daily tracking survey.
In recent weeks there have been some fluctuations within a three-point range in the percentages preferring the Republican (from 46% to 49%) and Democratic (from 43% to 46%) candidates. All of these fluctuations are within the margin of sampling error.
Nevertheless, all of the recent results are more favorable to Republicans than Democrats. Historically, Democrats have almost always led on the generic ballot among all registered voters. But the size of that lead usually shrinks once turnout is factored in (something Gallup typically does in the fall of a midterm election year), given usual Republican advantages in voter turnout.
Democrats typically need a cushion of at least five percentage points among registered voters to maintain an advantage once turnout is taken into account. For example, Democrats consistently led by double digits among voters in 2006 before winning enough seats to take party control of the U.S. House, so they still held an advantage even with a Republican edge in turnout. In 1994, however, the best Republican year in recent memory, the generic ballot results among all registered voters generally showed a tied race or a Republican advantage for most of that election year.
Thus, this year's generic ballot results suggest a better Republican year than Democratic year. If polling continues to show a close race, Democrats would need unusually strong turnout to be competitive in the fall. Perhaps in recognition of these patterns, the Democratic Party has announced an unprecedented voter mobilization effort to try to turn out sympathetic voters in an attempt to hold on to the gains they have made in the past two elections.
GOP Voters Continue to Be More Enthusiastic
Republicans also continue to hold an advantage in expressed enthusiasm about voting. Currently, 42% of Republicans say they are very enthusiastic about voting, compared with 27% of Democrats. That 15-point gap in enthusiasm is typical of what Gallup has measured this year.
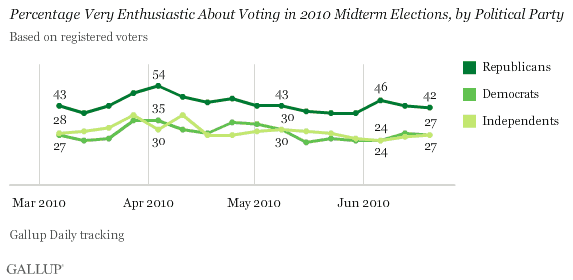
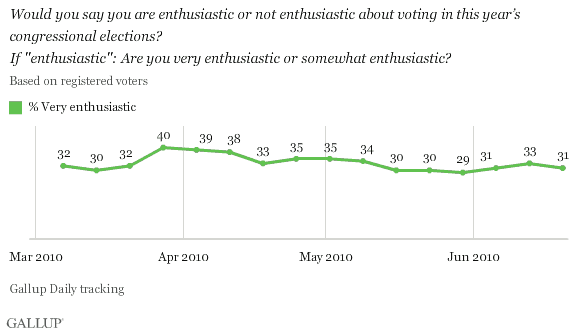
Republicans continue to hold an edge in enthusiasm even though overall voter enthusiasm is down from earlier in the campaign. In late March, 40% of all registered voters said they were very enthusiastic about voting. In the latest data, 31% are, and since mid-May the number has been no higher than 33%.
Bottom Line
Though there have recently been some minor fluctuations in Gallup's weekly tracking results of registered voters' congressional voting preferences, these have generally been fairly closely divided this year, and they point to a better year for Republicans than for Democrats.
Survey Methods
Results are based on telephone interviews conducted as part of Gallup Daily tracking/the Gallup Healthways Well-Being Index survey June 14-20, 2010, with a random sample of 1,612 adults, aged 18 and older, living in all 50 U.S. states and the District of Columbia, selected using random-digit-dial sampling.
For results based on the total sample of national adults, one can say with 95% confidence that the maximum margin of sampling error is ±3 percentage points.
Interviews are conducted with respondents on landline telephones and cellular phones, with interviews conducted in Spanish for respondents who are primarily Spanish-speaking. Each daily sample includes a minimum quota of 150 cell phone respondents and 850 landline respondents, with additional minimum quotas among landline respondents for gender within region. Landline respondents are chosen at random within each household on the basis of which member had the most recent birthday.
Samples are weighted by gender, age, race, Hispanic ethnicity, education, region, adults in the household, cell phone-only status, cell phone-mostly status, and phone lines. Demographic weighting targets are based on the March 2009 Current Population Survey figures for the aged 18 and older non-institutionalized population living in U.S. telephone households. All reported margins of sampling error include the computed design effects for weighting and sample design.
In addition to sampling error, question wording and practical difficulties in conducting surveys can introduce error or bias into the findings of public opinion polls.
For more details on Gallup's polling methodology, visit https://www.gallup.com/.