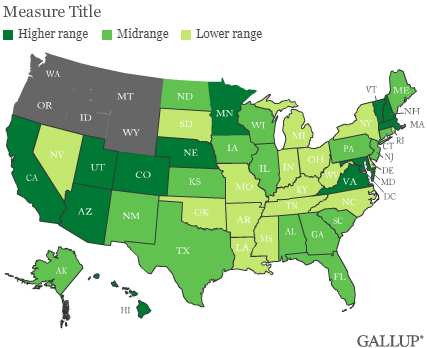
WASHINGTON, D.C. -- West Virginia, Kentucky, Mississippi, and Arkansas have the highest obesity rates in America in the first half of 2010. Colorado, Massachusetts, Utah, and Hawaii have the lowest rates. Obesity rates are more than nine percentage points higher, on average, in the 10 most obese states compared with the 10 least obese states (31.4% vs. 22.3%, respectively).
According to Gallup-Healthways Well-Being Index midyear results, an average of 26.7% of Americans were obese in the first six months of 2010, similar to the 26.5% average for all of 2009, but up significantly from 25.5% in 2008. These midyear results for the nation and for each state are based on respondents' self-reports of their height and weight, which are then used to calculate standard Body Mass Index (BMI) scores. Individual BMI values of 30 or above are classified as "obese."
Across the U.S., Gallup finds the highest obesity rates in the South and Midwest and the lowest in the West and Mountain West. The Northeast has a mixture of states with high and low levels of obesity.
See complete data for all states on page 2.
Obesity is also generally increasing at a faster rate among the states that already have the highest percentage of obese residents, with 5 of the 10 most obese states also appearing on the top 10 list of greatest increases in obesity rates since 2008. Collectively, obesity rates rose by 2.2 points in the 10 most obese states in the first half of 2010 compared with 2008. In the 10 least obese states, obesity rates increased 0.7 points over the same time period. Among all states during this time, obesity rates have increased the most in New Hampshire (+6.0 points), Wyoming (+5.7), Maine (+4.6), and South Dakota (+4.5).
Delaware (down 2.7 points) and Rhode Island (down 1.2 points) are the only two states with at least one-point declines in obesity since 2008.
High Blood Pressure Diagnosis Rampant in High Obesity States
The Gallup-Healthways Well-Being Index data underscore the extent of the relationship between obesity and high blood pressure. On average, 26.1% of residents in the 10 states with the lowest obesity rates report having ever been diagnosed with high blood pressure, compared with 35.7% of those living in the 10 states with the highest obesity rates. Diagnoses of high cholesterol, diabetes, and heart attack are all also higher in the states with the highest obesity rates as are days missed of normal activity due to health problems.
Implications
Taken together, these data reveal where America's obesity crisis is hitting the hardest. The most obese states in America have higher-than-average rates of residents facing serious health challenges, thus likely elevating healthcare costs. It is also alarming that even in the least obese state in the country, Colorado, one in five residents are obese and that nationwide obesity is on the rise.
These data call into question whether efforts to fight obesity are paying off at significant rates, though these efforts may have received a boost when First Lady Michelle Obama launched her own campaign to combat childhood obesity earlier this year. As new laws for "sugar taxes" are passed and implemented in states such as Washington, Colorado, and Iowa, the Gallup-Healthways Well-Being Index will help to ascertain whether they are able to create any measurable improvement in obesity. In the meantime, it is clear that every state in the nation has work to do to reverse an alarming trend with implications for America's collective physical health and financial bottom line.
This story is part of a series of midyear updates on Gallup's State of the States data, to be released in July and August on Gallup.com. See the complete schedule and send your suggestion for our "readers' pick." Gallup.com will report new full-year totals in early 2011 based on all 2010 surveys.
Learn more about the Gallup-Healthways Well-Being Index.
Survey Methods
Results are based on telephone interviews with 176,193 national adults, aged 18 and older, conducted Jan. 2-June 30, 2010, as part of the Gallup-Healthways Well-Being Index. For results based on the total sample of national adults, one can say with 95% confidence that the maximum margin of sampling error is ±0.3 percentage points.
The margin of sampling error for most states is ±1 to ±2 percentage points, but is as high as ±4 percentage points for smaller states such as Wyoming, North Dakota, South Dakota, Delaware, and Hawaii.
Interviews are conducted with respondents on landline telephones (for respondents with a landline telephone) and cellular phones (for respondents who are cell phone only).
In addition to sampling error, question wording and practical difficulties in conducting surveys can introduce error or bias into the findings of public opinion polls.
About the Gallup-Healthways Well-Being Index
The Gallup-Healthways Well-Being Index measures the daily pulse of U.S. well-being and provides best-in-class solutions for a healthier world. To learn more, please visit well-beingindex.com.