GALLUP NEWS SERVICE
PRINCETON, NJ -- While 2004 rates as a disappointment for Democrats because of their national election losses, the party did make some gains in partisanship among Americans, compared with the prior two years. An analysis of Gallup's 2004 data shows that Massachusetts rates as the most Democratic U.S. state, while Utah and Idaho are the most Republican. A comparison of state partisanship with the 2004 election outcome shows George W. Bush tended to do better in most states than what would be expected based on the states' overall political leanings.
A review of all Gallup national polling from 2004, a total of more than 37,000 individual interviews, finds 34% of Americans identifying themselves as Republicans, 34% as Democrats, and 31% as independents. When independents are asked if they "lean" toward either party, the Democrats pick up an additional 14 percentage points of support (to a total of 48% identifiers and "leaners") while Republican support increases to 45%. The remaining 7% identify themselves as independents and profess no leaning toward either party.
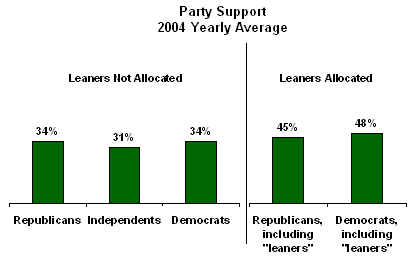
In 2003, equal percentages of Americans (45%) identified with or leaned toward each of the two major parties, the same result as in 2002. So the latest data suggest an increase in Democratic support over the past couple of years, with no change in Republican support. (The basic party identification numbers -- which do not take into account independents' leanings -- also show about a three-point increase in Democratic identification compared with 2003, from 31% to 34%. Republican identification increased from 32% to 34%, while independent identification dropped from 36% to 31%.)
However, despite the Democratic gains, Republicans were more likely to turn out in the 2004 elections, wiping out the three-point Democratic advantage in party support among all adults. According to Gallup's estimates, 48% of likely voters were Republicans or leaned toward the Republican Party, and 48% were Democrats or leaned toward the Democratic Party.
Party Support in the States
The large number of interviews Gallup conducted last year allows for an in-depth look at partisanship -- specifically, how party support varies by state.
|
Party Identification by State, 2004 Gallup Polls
|
|||||
|
State |
% |
% |
% |
Number of |
Advantage |
|
|
|
|
|
(pct. pts.) |
|
|
Utah |
65.2 |
5.7 |
29.1 |
374 |
36.1 |
|
Idaho |
64.8 |
2.5 |
32.7 |
248 |
32.1 |
|
Kansas |
58.5 |
5.6 |
36.0 |
396 |
22.5 |
|
Wyoming |
58.5 |
5.2 |
36.2 |
103 |
22.3 |
|
Texas |
55.5 |
5.8 |
38.8 |
2,236 |
16.7 |
|
South Dakota |
55.4 |
5.7 |
38.9 |
98 |
16.4 |
|
Montana |
53.4 |
8.7 |
37.9 |
221 |
15.5 |
|
Maine |
53.2 |
6.3 |
40.5 |
227 |
12.8 |
|
Nebraska |
54.0 |
4.8 |
41.2 |
278 |
12.8 |
|
Indiana |
53.2 |
5.2 |
41.6 |
871 |
11.5 |
|
Virginia |
52.0 |
7.3 |
40.7 |
964 |
11.2 |
|
Arizona |
51.7 |
6.8 |
41.5 |
694 |
10.3 |
|
Mississippi |
51.9 |
4.3 |
43.8 |
334 |
8.1 |
|
Georgia |
50.4 |
6.6 |
43.0 |
1,026 |
7.4 |
|
South Carolina |
51.1 |
4.9 |
44.0 |
535 |
7.2 |
|
Nevada |
51.1 |
4.6 |
44.3 |
277 |
6.8 |
|
Alabama |
49.9 |
6.9 |
43.2 |
618 |
6.7 |
|
North Dakota |
50.3 |
5.4 |
44.3 |
90 |
6.0 |
|
Delaware |
48.8 |
6.7 |
44.5 |
106 |
4.3 |
|
Oklahoma |
48.9 |
5.0 |
46.1 |
549 |
2.8 |
|
North Carolina |
48.3 |
5.1 |
46.6 |
1,108 |
1.6 |
|
Colorado |
47.6 |
6.4 |
46.0 |
683 |
1.5 |
|
New Hampshire |
46.7 |
6.9 |
46.4 |
200 |
0.2 |
|
Tennessee |
46.8 |
6.5 |
46.7 |
816 |
0.1 |
|
West Virginia |
48.5 |
2.8 |
48.6 |
283 |
-0.1 |
|
Florida |
46.2 |
6.2 |
47.6 |
1,888 |
-1.4 |
|
Missouri |
45.0 |
7.7 |
47.3 |
832 |
-2.3 |
|
Ohio |
45.2 |
6.4 |
48.4 |
1,601 |
-3.1 |
|
New Mexico |
46.0 |
4.6 |
49.4 |
262 |
-3.4 |
|
Pennsylvania |
45.2 |
4.7 |
50.1 |
2,141 |
-4.9 |
|
Oregon |
44.0 |
6.6 |
49.5 |
611 |
-5.5 |
|
Arkansas |
43.7 |
6.0 |
50.2 |
442 |
-6.5 |
|
New Jersey |
43.7 |
5.9 |
50.5 |
978 |
-6.8 |
|
Kentucky |
43.0 |
5.9 |
51.1 |
676 |
-8.1 |
|
Louisiana |
42.6 |
6.6 |
50.8 |
590 |
-8.2 |
|
Michigan |
40.9 |
9.9 |
49.2 |
1,229 |
-8.3 |
|
California |
42.2 |
6.0 |
51.8 |
3,606 |
-9.6 |
|
Wisconsin |
40.5 |
8.6 |
50.9 |
719 |
-10.4 |
|
Minnesota |
41.5 |
6.3 |
52.3 |
712 |
-10.8 |
|
Connecticut |
41.4 |
6.1 |
52.5 |
478 |
-11.0 |
|
Washington |
40.7 |
6.4 |
52.9 |
997 |
-12.2 |
|
Iowa |
40.3 |
6.3 |
53.4 |
472 |
-13.2 |
|
Illinois |
39.4 |
5.8 |
54.9 |
1,262 |
-15.5 |
|
New York |
38.4 |
6.3 |
55.3 |
2,091 |
-16.9 |
|
Maryland |
37.5 |
5.4 |
57.1 |
705 |
-19.5 |
|
Rhode Island |
35.8 |
8.6 |
55.6 |
156 |
-19.8 |
|
Vermont |
33.2 |
7.2 |
59.7 |
129 |
-26.5 |
|
Massachusetts |
32.3 |
6.3 |
61.4 |
879 |
-29.1 |
|
District of Columbia |
11.4 |
5.1 |
83.5 |
75 |
-72.1 |
|
^ Positive scores indicate states with a Republican advantage; negative scores indicate those with a Democratic advantage. |
|||||
The data show that Utah and Idaho rate as the most Republican
states, with roughly 65% of residents in both states identifying
themselves as Republicans or saying they lean toward the Republican
Party. Four other states have 55% or more of their residents on the
Republican side of the ledger: Kansas (59%), Wyoming (59%), Texas
(56%), and South Dakota (55%). Eleven additional states have
majority Republican identification: Montana, Maine, Nebraska,
Indiana, Virginia, Arizona, Mississippi, Georgia, South Carolina,
Nevada, and North Dakota.
The most Democratic states are Massachusetts (61%) and Vermont (60%). The District of Columbia is also strongly Democratic, apparently more so than those states, but that is based on a limited sample of capital residents.
Seventeen states have majority Democratic identification. In addition to Massachusetts and Vermont, the states having more than 50% Democratic supporters are Rhode Island, Maryland, New York, Illinois, Iowa, Washington, Connecticut, Minnesota, Wisconsin, California, Louisiana, Kentucky, New Jersey, Arkansas, and Pennsylvania.
The most competitive states -- those with nearly equal percentages of Democratic and Republican supporters -- include Missouri, Florida, West Virginia, Tennessee, New Hampshire, Colorado, and North Carolina. In all those states, neither party has more than a two percentage-point advantage over the other.
State Partisanship and the 2004 Election
While for the most part, the strongly Democratic states went for Democratic presidential nominee John Kerry and the strongly Republican states went for Bush, the election outcomes in the states did not show a perfect relationship to the states' partisanship. For example, Tennessee was one of the two most evenly balanced states in terms of party support, but Bush won comfortably there. Thus, the state partisanship data displayed above can give an indication of where the candidates did better or worse than could be expected on the basis of the prevailing party leanings of the state.
The graph plots the larger states (those in which Gallup conducted 280 or more interviews in 2004, that is, states with a margin of sampling error of ±6 percentage points or less) on two dimensions: the relative advantage of one party over the other on state partisanship, and the difference between the parties' relative strengths and the outcome of the 2004 election.
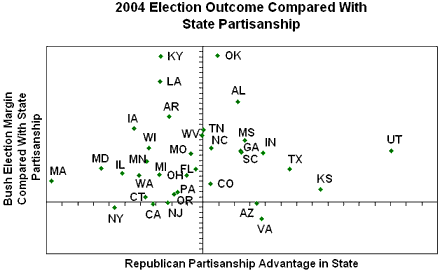
The horizontal axis shows the advantage for one party over the other in terms of each state's partisanship. States farther to the right on this axis (such as Utah) have a greater Republican advantage in party identification, while states to the left (such as Massachusetts) have a greater Democratic Party advantage.
The vertical axis shows the difference between Bush's 2004 election margin in each state and the party advantage in that state. States plotted well above the horizontal line are those where Bush did much better than might be expected, given the partisanship of those states. States plotted below the horizontal line are states in which Kerry did better (or Bush did worse) than would be expected.
For example, Oklahoma is the state farthest above the horizontal line. In 2004, Oklahomans' party affiliations showed a narrow Republican advantage of 3 points (49% to 46%), but the state voted for Bush by a 32-point margin. States close to the horizontal line had 2004 vote outcomes similar to their partisanship -- for example, New York had a 17-point Democratic advantage in partisanship, and Kerry won the state's presidential election by virtually the same margin, 18 percentage points.
The graph shows that Bush did better than might be expected, given the state partisanship, in most states. In fact, only a few fall below the horizontal line, suggesting Kerry did better than would be expected (although that does not include several smaller states in which Kerry did better, including Maine, Delaware, and Nevada). The states in which Bush did considerably better were Oklahoma, Kentucky, Louisiana, Alabama, Arkansas, Iowa, Tennessee, Mississippi, and North Carolina.
The fact that Bush tended to do better in the election than what would be expected on the basis of state partisanship alone is likely attributable to several factors.
- As mentioned, Republicans typically are more likely than Democrats to turn out to vote. So everything else being equal, one would expect a Republican candidate to do better than the state's party leanings among all adults because of differences in turnout between Republican and Democratic supporters.
- Bush probably was helped by his status as an incumbent, especially given that the country was at war.
- Despite their long history of Democratic control of local offices, in recent decades Southern states have reliably supported Republican presidential candidates. Gradually, Republicans are replacing the conservative Democratic officeholders in those states, which is evident by the Republicans gaining five Southern Senate seats this past election that were previously held by Democrats. Indeed, the list of states in which Bush did far better than would be expected on partisanship alone is dominated by Southern states.
These results are based on combined data from 37,330 telephone interviews in Gallup Polls conducted in 2004. For individual states, the maximum margins of sampling error vary from ±2 percentage points for California to ±11 points for North Dakota. The margin of error for Washington, D.C., is ±13 percentage points. The typical state, which would have about 750 interviews, has a margin of sampling error of ±4 percentage points. In addition to sampling error, question wording and practical difficulties in conducting surveys can introduce error or bias into the findings of public opinion polls.