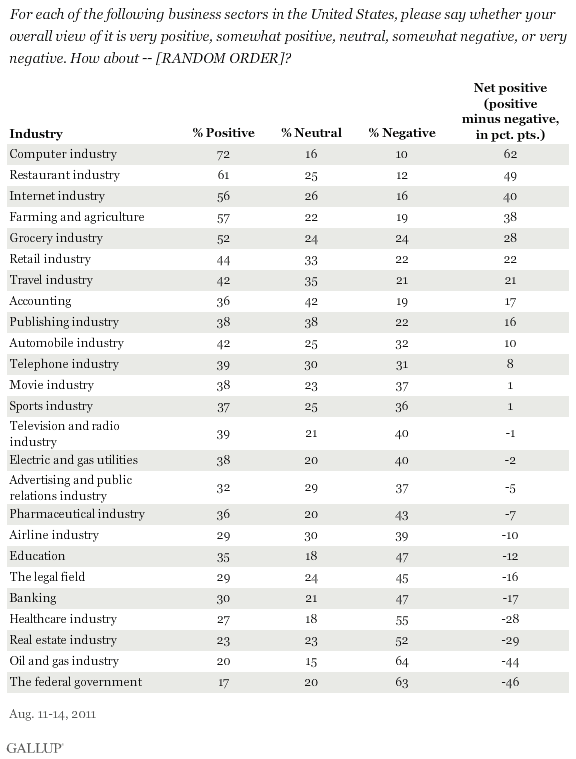
PRINCETON, NJ -- Americans view the computer industry the most positively and the federal government the least positively when asked to rate 25 business and industry sectors. All five of the top-rated sectors this year are related to either computers or food.

Gallup has asked Americans each August since 2001 to indicate whether they have positive or negative views of a list of business and industry sectors. The 2011 update is from Gallup's Aug. 11-14 survey.
The results range from a +62 net positive rating for the computer industry to a -46 net positive rating for the federal government.
The sectors Americans view most negatively have all had well-publicized problems in recent years. The federal government has been near the bottom of the list in previous years, but is at the absolute bottom this year for the first time, displacing the oil and gas industry. Seventeen percent of Americans have a positive view of the federal government -- the lowest of any sector tested this year -- while 63% have a negative image. Only one sector, oil and gas, has a higher negative percentage, 64%. Other poorly ranked sectors include real estate, healthcare, banking, and the legal field.
Federal Government's Image at All-Time Low
The positive and the negative ratings for the federal government this year are the worst since Gallup began measuring its image in 2003.

The deterioration in Americans' views of the federal government began in 2004 -- correlated with a downturn in President George W. Bush's job approval rating and rising concerns about the Iraq war and the economy. Views turned slightly more positive in 2009 during Barack Obama's first year as president, but dropped back down last year and again this year, likely reflecting rising concerns over the economy as well as the increase in government spending and power.
Other Gallup data from August of this year show that Congress has the lowest approval rating in Gallup history, and that satisfaction with the way things are going in this country is near its all-time low.
Images of Federal Gov't, Real Estate Industry Drop the Most Over the Past Decade
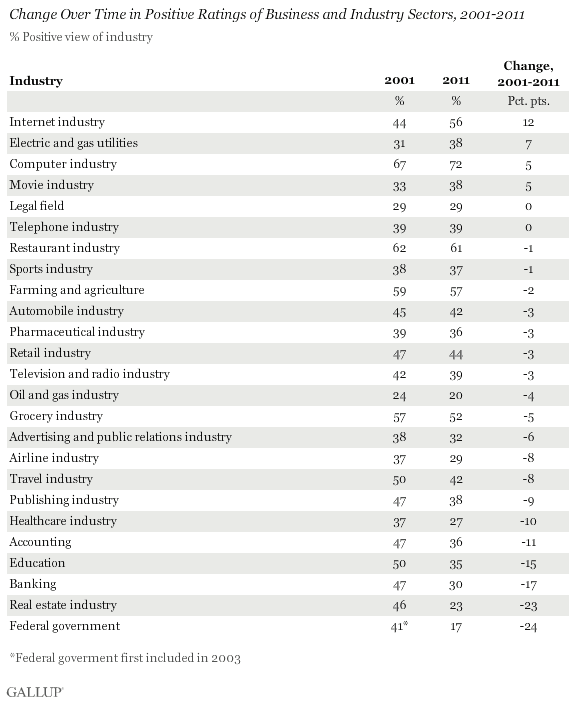
Americans' views of a number of sectors have worsened dramatically between 2001 and 2011, or, in the case of the federal government, between 2003 -- the first year Gallup asked about it -- and 2011.
The images of the federal government and the real estate industry have dropped the most over the past decade. The percentage of Americans rating the government positively has declined 24 points since 2003, and the real estate industry's positive ratings have fallen 23 points since 2001. Other sectors with double-digit drops include the banking sector, education, accounting, and healthcare.
Americans view four industries more positively now than they did in August 2001: the Internet industry, electric and gas utilities, and the computer and movie industries. The current 72% positive rating for the computer industry is the highest such rating of any industry since Gallup began tracking business sectors in 2001.

Implications
The continuing high ratings for the computer and Internet industries likely reflect the global success of such American companies as Google, Apple, and Facebook, the technology industry's apparent success even in this time of economic uncertainty, and the increasingly major role that technology plays in Americans' lives. It is less clear why food-related sectors such as the restaurant industry, farming and agriculture, and the grocery industry do so well in the eyes of Americans, but it could reflect the United States' relatively noncontroversial and efficient food supply system.
At the other end of the spectrum, poorly rated sectors have been associated with various well-publicized political or economic problems in recent years. Americans' frustration with politicians and Washington -- exacerbated by the contentious debt ceiling negotiations -- comes through in the federal government's all-time low image rating. The oil and gas industry has never done well in these image assessments, which is likely tied to swings in gas prices and the overall high price of gas.
The bad image of the real estate industry most likely reflects the housing crisis that has beset the country in recent years, and the poor image of the healthcare industry may reflect the rising cost of healthcare and uncertainly about access issues. Americans continue to view banks poorly, which clearly reflects lingering concerns from the 2008 financial crisis and subsequent failure of many banks around the country. Lawyers and the legal field have never had positive images.
Survey Methods
Results for this Gallup poll are based on telephone interviews conducted Aug. 11-14, 2011, with a random sample of 1,008 adults, aged 18 and older, living in the continental U.S. selected using random digit dial sampling.
Each respondent rated a randomly selected list of 13 of 25 industries. The data for each industry are thus based on approximately 500 national adults.
For results based on these total samples of national adults, one can say with 95% confidence that the maximum margin of sampling error is ±5 percentage points.
Interviews are conducted with respondents on landline telephones and cellular phones, with interviews conducted in Spanish for respondents who are primarily Spanish-speaking. Each sample includes a minimum quota of 400 cell phone respondents and 600 landline respondents per 1,000 national adults, with additional minimum quotas among landline respondents by region. Landline telephone numbers are chosen at random among listed telephone numbers. Cell phone numbers are selected using random-digit-dial methods. Landline respondents are chosen at random within each household on the basis of which member had the most recent birthday.
Samples are weighted by gender, age, race, Hispanic ethnicity, education, region, adults in the household, and phone status (cell phone only/landline only/both, cell phone mostly, and having an unlisted landline number). Demographic weighting targets are based on the March 2010 Current Population Survey figures for the aged 18 and older non-institutionalized population living in U.S. telephone households. All reported margins of sampling error include the computed design effects for weighting and sample design.
In addition to sampling error, question wording and practical difficulties in conducting surveys can introduce error or bias into the findings of public opinion polls.
View methodology, full question results, and trend data.
For more details on Gallup's polling methodology, visit www.gallup.com.
