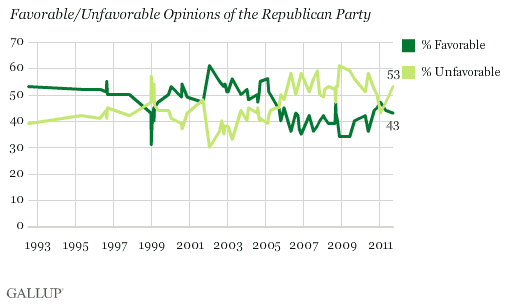
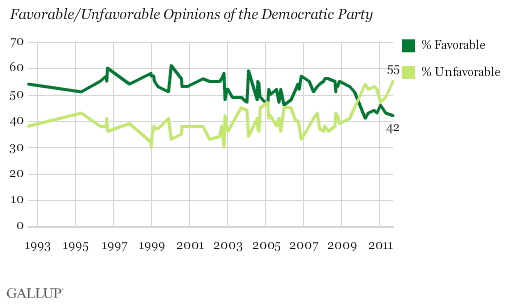
PRINCETON, NJ -- Americans have similar, mostly negative views of the Republican and the Democratic parties. Gallup's Sept. 8-11 update on party favorable ratings shows 53% viewing the Republican Party unfavorably and 43% favorably, and 55% having an unfavorable and 42% a favorable view of the Democratic Party.


Americans have generally viewed both parties more negatively than positively over the last two years. That is part of a large trend of mainly negative views of the GOP dating back to late 2005, while negativity toward the Democratic Party has been rare. Gallup first asked party favorables in 1992 and more Americans have viewed the Democratic Party unfavorably than favorably in just eight instances, all but one occurring since March 2010.
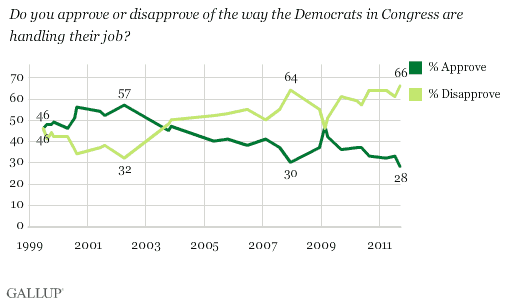
The public is even more critical of the parties when asked to evaluate the job the parties in Congress are doing. A Sept. 15-18 USA Today/Gallup poll finds 26% of Americans approving and 68% disapproving of the Republicans in Congress, and 28% approving and 66% disapproving of the Democrats in Congress.
The 28% approval rating for the Democrats in Congress is the worst Gallup has measured since the question was first asked in 1999. The prior low was 30% in December 2007.

Approval of congressional Republicans is also near the historical low -- one percentage point higher than the 25% measured in December 2008. Since 2006, approval of the Republicans in Congress has only been as high as 36%.

Americans in recent years have generally been more likely to disapprove than approve of the job both parties in Congress are doing. A few exceptions were recorded in the late 1990s and early 2000s, spanning a time that included a strong economy and a rally in support for government institutions after the Sept. 11, 2001, terrorist attacks.
Implications
Americans currently rate the Republican Party as better than the Democratic Party at keeping the country prosperous, protecting the country from terrorism and international threats, and at being better able to handle the most important problem facing the country.
But that may be the result of the public's widespread dissatisfaction with the way things are going in the United States and the fact that a Democrat occupies the White House, rather than an endorsement of Republican performance or policies. In a broad sense, Americans do not view the Republican Party any more positively than the Democratic Party.
That helps explain why a majority of Americans favor a third party, and why Americans do not view one-party control of the presidency and Congress as a solution to what ails the federal government.
Survey Methods
Results for this are based on 1,017 telephone interviews conducted Sept. 8-11, 2011, and 1,004 interviews conducted Sept. 15-18, 2011, with random samples of national adults, aged 18 and older, living in all 50 U.S. states and the District of Columbia.
For results based on these total samples of national adults, one can say with 95% confidence that the maximum margin of sampling error is ±4 percentage points.
Interviews are conducted with respondents on landline telephones and cellular phones, with interviews conducted in Spanish for respondents who are primarily Spanish-speaking. Each sample includes a minimum quota of 400 cell phone respondents and 600 landline respondents per 1,000 national adults, with additional minimum quotas among landline respondents by region. Landline telephone numbers are chosen at random among listed telephone numbers. Cell phone numbers are selected using random-digit-dial methods. Landline respondents are chosen at random within each household on the basis of which member had the most recent birthday.
Samples are weighted by gender, age, race, Hispanic ethnicity, education, region, adults in the household, and phone status (cell phone only/landline only/both, cell phone mostly, and having an unlisted landline number). Demographic weighting targets are based on the March 2010 Current Population Survey figures for the aged 18 and older non-institutionalized population living in U.S. telephone households. All reported margins of sampling error include the computed design effects for weighting and sample design.
In addition to sampling error, question wording and practical difficulties in conducting surveys can introduce error or bias into the findings of public opinion polls.
View methodology, full question results, and trend data.
For more details on Gallup's polling methodology, visit www.gallup.com.
