WASHINGTON, D.C. -- While 64% of the U.S workforce is employed full time for an employer, as measured by Gallup from January to September 2011, this percentage ranges from a high of 73% among college graduates to a low of 29% among those aged 65 and older. An additional 7% work full time for themselves and 10% work part time and do not want full-time work, with those 65 and older by far the most likely to fit into these two categories.

Those employed full time for an employer, employed full time for themselves, or working part time by choice are considered fully employed. Men are more likely than women to be working full time for an employer, while women are more likely than men to be working part time with no desire for full-time work. Relatively few workers aged 65 and older are working full time, but 41% are satisfied with a part-time job. Americans with no college education are significantly less likely than their more educated counterparts to be working full time for an employer.
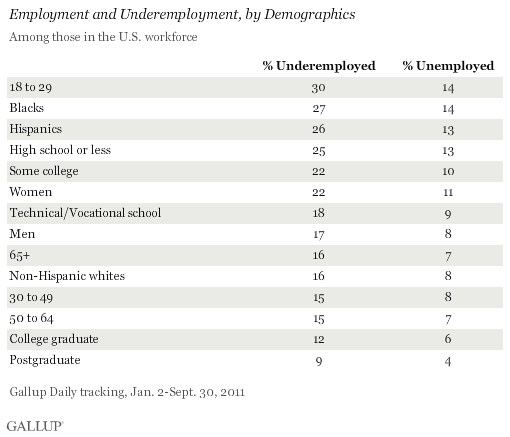
Those in the U.S. workforce who do not fit into the three categories above are considered underemployed. Young adults aged 18 to 29, minorities, women, and those with lower levels of education are significantly more likely than other groups to be underemployed. They are also the most likely to be unemployed, but the range for unemployment across demographics is much smaller overall.

Implications
Gallup finds that full-time employment, or "good jobs," with employers worldwide is linked to higher GDP and improved well-being. At the same time, globally, self-employment is not associated with these benefits because self-employed workers in developing countries typically work in subsistence jobs. In contrast, in the United States, most of the self-employed are business owners, professional workers, or skilled trade workers. An additional group of workers is working part time but does not want full-time work. These three groups are fully employed.
In the U.S., the highly educated are most likely to be working full time for an employer, highlighting the benefits of a good education during these difficult economic times. It is not surprising that women and older workers are the most likely to be working part time with no desire to work full time. Many may be supplementing child rearing or retirement with additional income and likely improving their overall well-being. Younger workers may also lag behind in good jobs because they lack the experience to beat out more tenured workers for the best jobs. Unemployment remains at historically high levels, and economists warn of a possible double dip. Despite this, the majority of U.S. workers are working full-time in formal jobs.
Gallup.com reports results from these indexes in daily, weekly, and monthly averages and in Gallup.com stories. Complete trend data are always available to view and export in the following charts:
Daily: Employment, Economic Confidence and Job Creation, Consumer Spending
Weekly: Employment, Economic Confidence, Job Creation, Consumer Spending
Read more about Gallup's economic measures.
View our economic release schedule.
Survey Methods
Results are based on telephone interviews conducted as part of Gallup Daily tracking from Jan. 2-Sept. 30, 2011, with a random sample of approximately 160,000 adults who are part of the workforce, aged 18 and older, living in all 50 U.S. states and the District of Columbia, selected using random-digit-dial sampling.
For results based on a typical monthly sample of national adults, one can say with 95% confidence that the maximum margin of sampling error is less than ±1 percentage point. For each demographic group, one can say with 95% confidence that the maximum margin of error ranges from less than ±1 percentage point to no more than ±3.5 percentage points for any group.
Interviews are conducted with respondents on landline telephones and cellular phones, with interviews conducted in Spanish for respondents who are primarily Spanish-speaking. Each sample includes a minimum quota of 400 cell phone respondents and 600 landline respondents per 1,000 national adults, with additional minimum quotas among landline respondents by region. Landline telephone numbers are chosen at random among listed telephone numbers. Cell phone numbers are selected using random-digit-dial methods. Landline respondents are chosen at random within each household on the basis of which member had the most recent birthday.
Samples are weighted by gender, age, race, Hispanic ethnicity, education, region, adults in the household, and phone status (cell phone only/landline only/both, cell phone mostly, and having an unlisted landline number). Demographic weighting targets are based on the March 2010 Current Population Survey figures for the aged 18 and older non-institutionalized population living in U.S. telephone households. All reported margins of sampling error include the computed design effects for weighting and sample design.
In addition to sampling error, question wording and practical difficulties in conducting surveys can introduce error or bias into the findings of public opinion polls.
For more details on Gallup's polling methodology, visit www.gallup.com.
