PRINCETON, NJ -- Underemployment rates were lowest -- below 12% -- in North and South Dakota in 2011. A group of five states, including two of the most populous, California and Florida, had the highest underemployment rates in the country -- 21% or higher.
 |
| Explore complete state data > |
Gallup classifies respondents as "underemployed" if they are either unemployed or are employed part time (fewer than 30 hours per week) and wish to be employed full time. Gallup's definition of unemployment closely follows the U.S. government's definition; respondents are "unemployed" if they don't have a job, and are actively looking for work and available to begin work. Gallup reports underemployment by state in the following ranges: 6.0%-11.9%, 12.0%-14.9%, 15.0%-17.9%, 18.0%-20.9%, and 21.0%-24.0%.
Nationally, 18.6% of Americans were underemployed in 2011, a slight improvement from 18.9% in 2010.
However, these annual averages obscure significant seasonal variations. In 2011, underemployment reached as low as 17.8% in October, and as high as 19.9% in February.
There are striking state-by-state differences as well. The Dakotas stand apart as having the best employment picture in the country in 2011, followed by nine other states in the 12%-14.9% range, seven of which are in the Midwest or West. These include Wyoming, Iowa, Nebraska, Montana, Minnesota, Oklahoma, and Kansas. The other two states in this range are Hawaii and the lone Eastern state, Vermont.
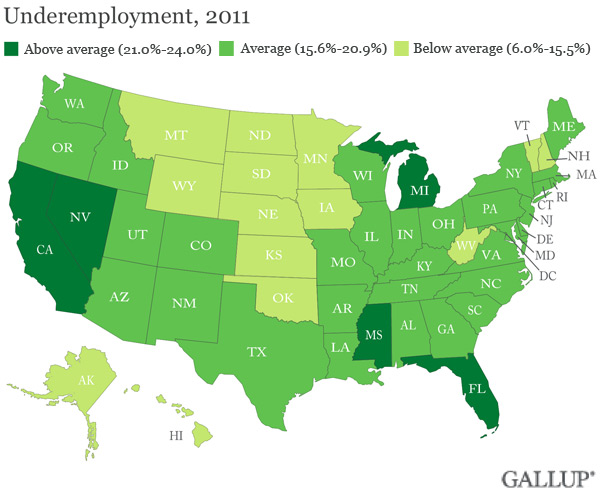
At the other end of the spectrum, the five states where underemployment is highest have little geographic homogeneity, ranging from California in the far West to Florida in the Southeast, with Nevada, Mississippi, and Michigan in between. Full data for each state are available on page 2.
Underemployment Not Necessarily Linked to Economic Confidence
Underemployment is not necessarily related to state-by-state patterns of economic confidence. In North Dakota's case, the positive underemployment situation does appear to translate into high economic confidence, given that the state in 2011 was second only to the District of Columbia on Gallup's Economic Confidence Index. On the other hand, Montana is in the second-best group of states based on their underemployment rates, but is tied for the third-worst Economic Confidence Index score of any state.
West Virginia, which is dead last on economic confidence, is in the middle of the list of states based on underemployment rates.
Implications
Gallup's state-by-state analysis of underemployment in 2011 reinforces the conclusion that not all states are created equal when it comes to the economy. Residents of the two Dakotas and a number of other Midwestern and Western states, along with Vermont and Hawaii, enjoyed relatively low underemployment rates last year. On the other hand, residents of California, Florida, Nevada, Mississippi, and Michigan suffered, with many more residents of those states either unemployed or working part time but wanting full-time jobs.
Gallup's "State of the States" series reveals state-by-state differences on political, economic, and well-being measures Gallup tracks each day. New stories based on full-year 2011 data will be released throughout the month of February.Survey Methods
Results are based on telephone interviews conducted as part of Gallup Daily tracking January-December, 2011, with a random sample of 214,822 adults, aged 18 and older, living in all 50 U.S. states and the District of Columbia.
For results based on the total sample of workers, one can say with 95% confidence that the maximum margin of sampling error is ±1 percentage point.
Margins of error for individual states are no greater than ±5 percentage points, and are ±3 percentage points in most states. The margin of error for the District of Columbia is ±5 percentage points.
Interviews are conducted with respondents on landline telephones and cellular phones, with interviews conducted in Spanish for respondents who are primarily Spanish-speaking. Each sample includes a minimum quota of 400 cell phone respondents and 600 landline respondents per 1,000 national adults, with additional minimum quotas among landline respondents by region. Landline telephone numbers are chosen at random among listed telephone numbers. Cell phone numbers are selected using random-digit-dial methods. Landline respondents are chosen at random within each household on the basis of which member had the most recent birthday.
Samples are weighted by gender, age, race, Hispanic ethnicity, education, region, adults in the household, and phone status (cell phone only/landline only/both, cell phone mostly, and having an unlisted landline number). Demographic weighting targets are based on the March 2011 Current Population Survey figures for the aged 18 and older non-institutionalized population living in U.S. telephone households. All reported margins of sampling error include the computed design effects for weighting and sample design.
In addition to sampling error, question wording and practical difficulties in conducting surveys can introduce error or bias into the findings of public opinion polls.
For more details on Gallup's polling methodology, visit www.gallup.com.