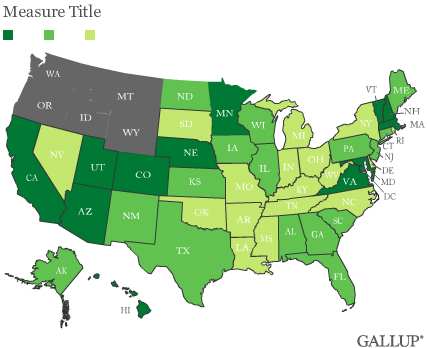
WASHINGTON, D.C. -- Colorado had the lowest adult obesity rate in the nation in 2011, as it did last year, and is the only state where fewer than 20% of adults are obese. West Virginia holds onto the negative distinction of being the state with the highest obesity rate; 35.3% of residents living there are obese, the highest for any state that Gallup and Healthways have found since 2008.
These data, collected as part of the Gallup-Healthways Well-Being Index, are based on respondents' self-reports of their height and weight, which are used to calculate Body Mass Index (BMI) scores. Americans who have a BMI of 30 or higher are classified as obese.
High Blood Pressure, Diabetes Rates Also Hold Steady Across States
As with obesity, Colorado and West Virginia continue to hold down the extremes, with the lowest and highest rates of high blood pressure and diabetes occurring in these states, respectively.
No state registered statistically significant increases in the percentage of residents who said they have ever been diagnosed with high blood pressure or diabetes in 2011 compared with 2010. The rates of the two diseases were unchanged in almost all states and even declined in some -- reflecting the slight decline in the rates for both diseases at the national level.
As most states' rates remained unchanged, it follows that the lists of the states with the highest and lowest diabetes and high blood pressure rates in 2011 are similar to 2010 and, as usual, look similar to the list of states where obesity is highest and lowest.
Southern, Midwestern States Still See Highest Obesity, Chronic Disease Rates
Obesity rates remain highest in many Southern and Midwestern states. Western and Northeastern states still boast the lowest obesity rates in the country. Diabetes and high blood pressure rates follow the same geographic pattern.
Health Habits Lag, Poor Health Outcomes Abound in States Where Obesity Is Highest
Healthy behaviors are highly correlated with low obesity levels, while poor health outcomes are strongly correlated with high obesity rates, according to a state-level correlation analysis of all of the 55 items the Gallup-Healthways Well-Being Index measures. Eating healthily, exercising frequently, not smoking, and having easy access to a place to exercise are among the behaviors or situations most strongly correlated with low obesity rates.
High blood pressure, diabetes, high cholesterol, heart attack, knee pain, headaches, and depression are among the most strongly correlated with high obesity rates. Residents' likelihood to say they have health problems that prevent them from doing things people their age can normally do is also strongly related to obesity.
The prevalence of these health conditions and behaviors in the 10 states with the highest and lowest obesity rates underscores their significant relationship to obesity.
Bottom Line
The Gallup-Healthways Well-Being Index documented no increases in any states' adult obesity rate in 2011. There was even a slight decline in the percentage of adults who were obese at the national level -- after increases in previous years. This indicates that the leveling off in the nation's obesity rate in 2009 and 2010 that the U.S. Centers for Disease Control and Prevention recently reported continued into 2011. Additionally, Gallup and Healthways found no meaningful increases in any states' diabetes or high blood pressure rates.
Despite the slight decline in obesity at the national level, more than 2 in 10 adults remain obese in all but one U.S. state. Three in 10 or more are obese in 10 states. Likewise, more than 2 in 10 adults have been diagnosed with high blood pressure is all 50 states, with nearly 4 in 10 reporting such diagnoses in a handful of states. Diabetes, although less common in general, also remains problematically high in many states.
An analysis of all of the 55 items in the Gallup-Healthways Well-Being Index underscores the areas on which leaders and individuals need to focus to make significant progress in decreasing the prevalence of obesity and its related chronic health issues. These include exercising frequently, eating healthily, and not smoking. While these health behaviors have a well-established connection to good health outcomes, it is clear that the American public is not yet fully embracing such lifestyle choices. However, adults in the states with lowest obesity rates are doing a better job than those in the states with highest obesity rates.
The Gallup-Healthways Well-Being Index analysis also highlights the relationship between high obesity rates and poor health outcomes across states, including high rates of chronic diseases, more headaches, and more pain. High levels of obesity are also a drain on productivity, as they are highly related to having health problems that keep a person from doing things someone his or her age can normally do.
Gallup's "State of the States" series reveals state-by-state differences on political, economic, and well-being measures Gallup tracks each day. New stories based on full-year 2011 data will be released throughout the month of February.
Learn more about the Gallup-Healthways Well-Being Index.
Survey Methods
Results are based on telephone interviews conducted as part of the Gallup-Healthways Well-Being Index survey Jan. 2-Dec. 29, 2011, with a random sample of 353,492 adults, aged 18 and older, living in all 50 U.S. states and the District of Columbia, selected using random-digit-dial sampling.
For results based on the total sample of national adults, one can say with 95% confidence that the maximum margin of sampling error is ±1 percentage point.
The margin of sampling error for most states is ±1 to ±2 percentage points, but is as high as ±4 points for states with smaller population sizes such as Wyoming, North Dakota, South Dakota, Delaware, and Hawaii.
Interviews are conducted with respondents on landline telephones and cellular phones, with interviews conducted in Spanish for respondents who are primarily Spanish-speaking. Each sample includes a minimum quota of 400 cell phone respondents and 600 landline respondents per 1,000 national adults, with additional minimum quotas among landline respondents by region. Landline telephone numbers are chosen at random among listed telephone numbers. Cell phone numbers are selected using random-digit-dial methods. Landline respondents are chosen at random within each household on the basis of which member had the most recent birthday.
Samples are weighted by gender, age, race, Hispanic ethnicity, education, region, adults in the household, and phone status (cell phone only/landline only/both, cell phone mostly, and having an unlisted landline number). Demographic weighting targets are based on the March 2010 Current Population Survey figures for the aged 18 and older non-institutionalized population living in U.S. telephone households. All reported margins of sampling error include the computed design effects for weighting and sample design.
In addition to sampling error, question wording and practical difficulties in conducting surveys can introduce error or bias into the findings of public opinion polls.
For more details on Gallup's polling methodology, visit www.gallup.com.