PRINCETON, NJ -- Gallup's Job Creation Index increased to +20 in April from +18 in March. Net new hiring is now at its best level since July 2008 and is near +26 -- the highest score Gallup has recorded since tracking began in January 2008.
The April Job Creation Index of +20 is based on 36% of workers nationwide saying their employers are hiring workers and expanding the size of their workforce, and 16% saying their employers are letting workers go and reducing the size of their workforce. This is similar to March, when 35% of workers reported workforce expansion at their place of work, while 17% reported workforce reduction.
The current 36% "hiring" figure is the highest since August 2008, and the current 16% "letting go" figure is the lowest since July of that year.
Net New Hiring Best in South
Regionally, job creation is best in the South, with an April Job Creation Index of +23, surpassing the Midwest at +21. The index is +18 in the West and +16 in the East.
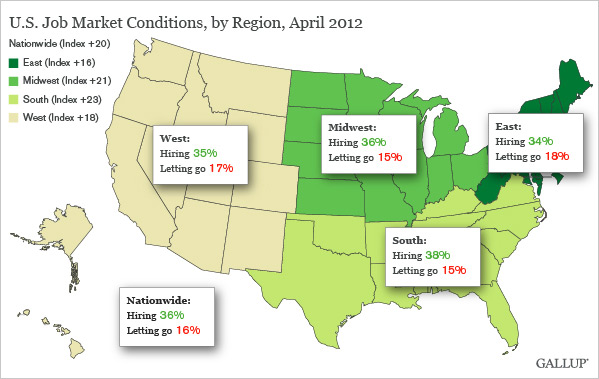
The West has seen the largest year-over-year improvement in the index, nine points, followed by the South at eight points. The index increased by six points in the Midwest and three points in the East during this time.
Job Growth Occurring in Private Sector, Not in Government
While private-sector workers report better levels of hiring, with a Job Creation Index of +25 in April, government employees are reporting more firing than hiring, with an index score of -7.
Job creation has been in negative territory in all areas of government since late 2011, though the federal government has recently been the most negative. In April, job creation was at -16 as reported by federal government employees, compared with -3 at state governments and -1 at local governments.
Implications
The fact that more employees are reporting that their companies are hiring and fewer say they are firing is good news for the U.S. job market and those looking for work. It is also consistent with the tendency for hiring to increase in April. Gallup's Job Creation Index is not seasonally adjusted, so some portion of April's increase likely reflects seasonal factors.
During April, the South and the West accounted for all of the increase in job creation at the national level. This may be partly the result of high gas prices and their tendency to stimulate jobs in the energy industry, which is heavily concentrated in those regions. It might also reflect some modest pickup in construction, remodeling, and other outdoor activities in some areas of the country more than others.
Private-sector job creation is improving even as federal government jobs are disappearing, and state and local government hiring remains weak. As has been seen in Europe, when government is forced to cut back, there are job implications in the short term. During the past two months, private-sector job creation has climbed to new highs, exceeding Gallup Daily tracking results going back to August 2008, when Gallup began measuring government vs. nongovernment employment.
Of course, the greater question is whether the improvement in job creation is more indicative of past reductions in the unemployment rate or of further declines yet to come. It may be that employees are reporting hiring that is tied to the unusually warm weather even in April. In turn, this may mean that the recent good news in terms of job creation is more a reflection of the unemployment rates of the first three months of this year than it is a glimpse of the near-term unemployment picture. In this regard, Gallup's unemployment numbers suggest the unemployment situation is not continuing to improve.
Gallup.com reports results from these indexes in daily, weekly, and monthly averages and in Gallup.com stories. Complete trend data are always available to view and export in the following charts:
Daily: Employment, Economic Confidence, Job Creation, Consumer Spending
Weekly: Employment, Economic Confidence, Job Creation, Consumer Spending
Read more about Gallup's economic measures.
View our economic release schedule.
Survey Methods
Results are based on telephone interviews conducted as part of Gallup Daily tracking April 1-30, 2012, with a random sample of 15,884 adults, aged 18 and older, employed full or part time, living in all 50 U.S. states and the District of Columbia.
For results based on the total sample of employed adults, one can say with 95% confidence that the maximum margin of sampling error is ±1 percentage point.
Interviews are conducted with respondents on landline telephones and cellular phones, with interviews conducted in Spanish for respondents who are primarily Spanish-speaking. Each sample includes a minimum quota of 400 cell phone respondents and 600 landline respondents per 1,000 national adults, with additional minimum quotas among landline respondents by region. Landline telephone numbers are chosen at random among listed telephone numbers. Cell phone numbers are selected using random-digit-dial methods. Landline respondents are chosen at random within each household on the basis of which member had the most recent birthday.
Samples are weighted by gender, age, race, Hispanic ethnicity, education, region, adults in the household, and phone status (cell phone only/landline only/both, cell phone mostly, and having an unlisted landline number). Demographic weighting targets are based on the March 2011 Current Population Survey figures for the aged 18 and older non-institutionalized population living in U.S. telephone households. All reported margins of sampling error include the computed design effects for weighting and sample design.
In addition to sampling error, question wording and practical difficulties in conducting surveys can introduce error or bias into the findings of public opinion polls.
For more details on Gallup's polling methodology, visit www.gallup.com.