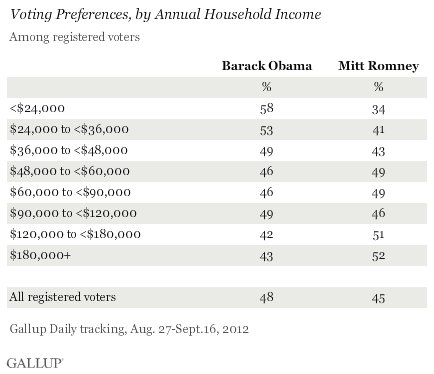
PRINCETON, NJ -- Although President Barack Obama has a substantial voting edge over Republican Mitt Romney among low-income Americans, Romney still gets about a third of the vote among those whose household incomes are less than $24,000 a year. Although Romney does better on the other end of the income scale, Obama gets the support of more than four in 10 Americans who make $180,000 a year or more.

These results, based on an analysis of Gallup Daily tracking data for the three-week period from Aug. 27-Sept. 16, show that while income is correlated with voter support, it is by no means a total determinant of vote choice.
The biggest distinction in vote choice by income comes at either end of the spectrum, among those with incomes less than $24,000 a year and among those with incomes $120,000 a year and more. But neither Obama nor Romney rises above 60% support among either of these groups.
The importance of income in the election was highlighted, at least indirectly, by a newly released video clip of Romney commenting at a fundraiser that President Obama's base supporters -- "47%" of Americans -- are people who pay no income tax and depend on government services.
Americans who pay no income tax cover the entire income spectrum, but most research shows that a large percentage of those non-payers are those in the lowest income households. Yet, even among those who make less than $24,000 a year in household income, 34% say they will vote for Romney.
The other segments of Americans who have a higher probability of paying no income tax are seniors dependent on Social Security income. However, a detailed analysis of voting choice by age shows that Americans 70 and older are among Romney's strongest voter segments, particularly those aged 70 to 79.

Age is not related to voter choice in a linear fashion, as these detailed data show. Obama does best among the younger voters, least well among those aged 40 to 49 and those aged 70 to 79 and closer to his overall average among the other age groups. Still, Romney's greatest support, as noted, includes those aged 70 to 79, among whom he has a 12-percentage-point lead over Obama, and with those aged 40 to 49, among whom he leads by seven points.
Older Americans who have low incomes are those who have the highest chance of paying no income tax. But the Gallup data for the period Aug. 27-Sept. 16 show that among those voters aged 65 and older who have $24,000 a year in income or less, Obama wins, with 49% of the vote, but 43% support Romney.
Implications
Romney's comments in the recently released video clip from a May fundraiser implied that he has written off as certain Obama voters about half of the population whom he says pay no income tax. Gallup does not track voters who pay no income tax, so it is not possible to isolate these voters precisely. Still, government data suggest that those who are most likely to pay no income tax are those who have very low incomes and are the youngest and oldest segments of society. Recent Gallup Daily tracking data show Romney in fact has significant support among these segments: those with the lowest incomes, the young, the old, and the older voters who have low incomes.
Track every angle of the presidential race on Gallup.com's Election 2012 page.
Survey Methods
Results are based on telephone interviews conducted as part of the Gallup Daily tracking survey Aug. 27-Sept. 16, 2012, with a random sample of 9,839 registered voters, aged 18 and older, living in all 50 U.S. states and the District of Columbia, selected using random-digit-dial sampling.
For results based on the total sample of registered voters, one can say with 95% confidence that the maximum margin of sampling error is ±1 percentage point.
Interviews are conducted with respondents on landline telephones and cellular phones, with interviews conducted in Spanish for respondents who are primarily Spanish-speaking. Each sample includes a minimum quota of 400 cell phone respondents and 600 landline respondents per 1,000 national adults, with additional minimum quotas among landline respondents by region. Landline telephone numbers are chosen at random among listed telephone numbers. Cell phone numbers are selected using random-digit-dial methods. Landline respondents are chosen at random within each household on the basis of which member had the most recent birthday.
Samples are weighted by gender, age, race, Hispanic ethnicity, education, region, adults in the household, and phone status (cell phone only/landline only/both, cell phone mostly, and having an unlisted landline number). Demographic weighting targets are based on the March 2011 Current Population Survey figures for the aged 18 and older non-institutionalized population living in U.S. telephone households. All reported margins of sampling error include the computed design effects for weighting and sample design.
In addition to sampling error, question wording and practical difficulties in conducting surveys can introduce error or bias into the findings of public opinion polls.
For more details on Gallup's polling methodology, visit https://www.gallup.com/.
