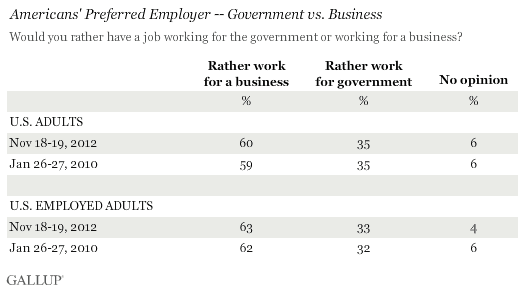
PRINCETON, NJ -- By 60% to 35%, more U.S. adults would rather work for a business than for government, unchanged from January 2010. Among those currently employed for pay, preferences are similar: 63% would rather work for business and 33% for government.

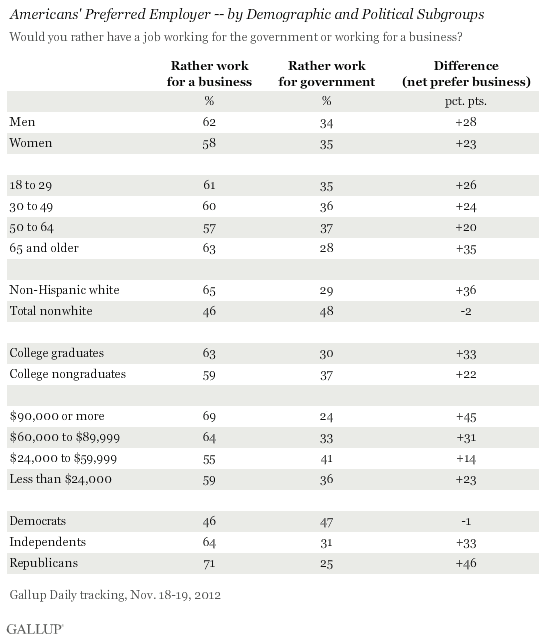
Gallup finds a distinct preference for private employment over government employment among nearly all population subgroups, except for nonwhites, who are about evenly divided. However, there is a particular penchant for private employment among Republicans, upper-income Americans, and whites, relative to their counterparts.

These results are based on a Gallup poll conducted Nov. 18-19 with 1,040 national adults. Sixty-two percent of those surveyed were employed for pay, including 11% who report working for government and 51% working for some other type of employer or for themselves, if they are self-employed. Thus, among the workers surveyed, 17% currently work for government and 82% work outside of government. These findings are similar to Gallup's latest annual findings on government employment, which show that 16.3% of workers in Gallup Daily tracking throughout 2011 said they work for government.
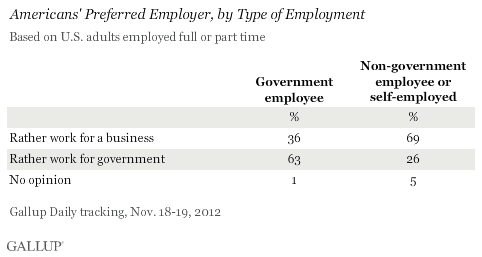
Most government workers appear to like their situations, and say they would prefer to work for government (63%) rather than business (36%). On the other hand, most workers now employed outside of government also appear to like their situations, and would prefer to work for a business (69%).
Still, it is important to note that the 33% of all employed Americans preferring to work for government is nearly double the 17% who currently do work for government.

Bottom Line
Americans continue to express a preference for non-government employment over government employment, this year by 60% to 35%. And this preference is evident among most population subgroups, although stronger among high-income Americans, whites, and Republicans than their counterparts.
However, despite the overall preference for non-government employment, more employed adults would rather work for government than currently do work for government, 33% vs. 17%. This suggests the remaining 16% consider government work more stable, more lucrative, and/or more fulfilling than their current work, potentially making hiring for government jobs more competitive than private-sector jobs.
Survey Methods
Results for this Gallup poll are based on telephone interviews conducted Nov. 18-19, 2012, on the Gallup Daily tracking survey, with a random sample of 1,013 adults, aged 18 and older, living in all 50 U.S. states and the District of Columbia.
For results based on the total sample of national adults, one can say with 95% confidence that the maximum margin of sampling error is ±4 percentage points.
Interviews are conducted with respondents on landline telephones and cellular phones, with interviews conducted in Spanish for respondents who are primarily Spanish-speaking. Each sample includes a minimum quota of 400 cellphone respondents and 600 landline respondents per 1,000 national adults, with additional minimum quotas among landline respondents by region. Landline telephone numbers are chosen at random among listed telephone numbers. Cellphone numbers are selected using random-digit-dial methods. Landline respondents are chosen at random within each household on the basis of which member had the most recent birthday.
Samples are weighted by gender, age, race, Hispanic ethnicity, education, region, adults in the household, population density, and phone status (cellphone only/landline only/both, cellphone mostly, and having an unlisted landline number). Demographic weighting targets are based on the March 2011 Current Population Survey figures for the aged 18 and older population living in U.S. All reported margins of sampling error include the computed design effects for weighting.
In addition to sampling error, question wording and practical difficulties in conducting surveys can introduce error or bias into the findings of public opinion polls.
View methodology, full question results, and trend data.
For more details on Gallup's polling methodology, visit www.gallup.com.
