PRINCETON, NJ -- Americans' economic confidence was better in November than in any month since Gallup began tracking confidence daily in January 2008. The -13 Economic Confidence Index score surpasses the previous bests of -17 from October and May of this year. The index, which began at -32 in January 2008 as the recession was taking hold, had been -20 or lower until May.
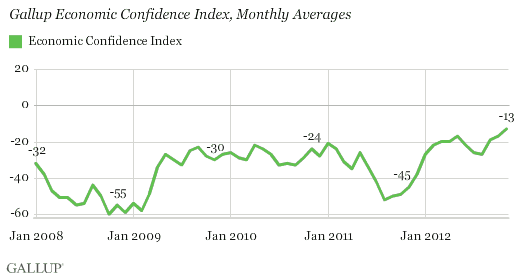
The higher November economic confidence scores were helped by a -10 in the week leading into the Nov. 6 election, the best weekly average to date in Gallup tracking. But confidence was generally stable throughout the month, with the weekly averages in November ranging from -10 to -15. Confidence has remained relatively stable even as the "fiscal cliff's" major tax increases and spending cuts loom unless the government can come to an agreement in the coming weeks.
Growing Confidence in Current and Future Economy
Gallup's economic confidence takes into account two sets of economic evaluations: Americans' ratings of current economic conditions and their outlook as to whether the economy is getting better or worse.
In November, 17% of Americans rated current conditions as "excellent" or "good" and 38% rated them as "poor." That net score of -21 indicates Americans remain more negative than positive about the economy, but on a relative basis, it is the best current conditions rating since March 2008 (-20).
The -5 economic outlook score, based on 45% saying the economy is getting better and 50% saying it is getting worse, is the best Gallup has measured since it began daily tracking in 2008. The prior best was last month's -10.
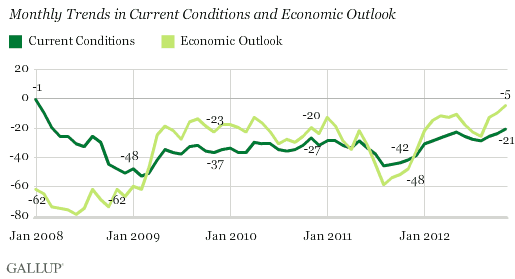
Thus, both economic measures are showing positive momentum, something they had been doing earlier this year before stalling a bit midyear.
Several Subgroups Now More Positive Than Negative About the Economy
As a result of the continuing improvement in Americans' economic confidence, several subgroups now have index scores that are in positive territory, suggesting they are more positive than negative toward the economy overall.
Leading the way are Democrats and blacks, with average index scores of 30 in November. Hispanics, postgraduates, and 18- to 29-year-olds are also in positive territory, with scores between 3 and 6. All of these groups are Democratic-leaning politically, and among President Obama's most consistent supporters, making their higher confidence not entirely surprising.
At the other end of the spectrum, Republicans were least confident among major subgroups in November, followed by a few other groups that have been more Republican leaning in the Obama era: whites, older Americans, and those who are married.
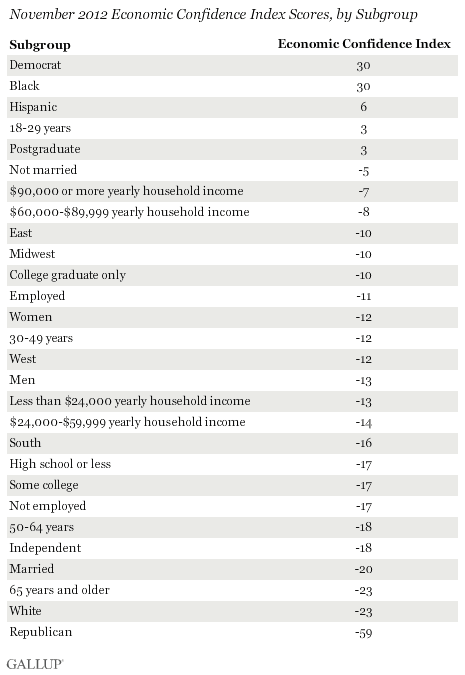
In addition to the political differences, there are modest income differences, with higher-income Americans (those whose annual household income is $60,000 or greater) slightly more optimistic about the economy those with lower household incomes.
Men (-13) and women (-12) have essentially the same level of economic confidence, and there are only modest regional differences.
Implications
Americans are more positive about the economy than they have been in nearly five years, with their ratings of current economic conditions and the economy's future course improving. There is variation in economic confidence by subgroup, the widest of which are by political orientation, with Democrats and Democratic-leaning groups much more positive than Republicans and Republican-leaning groups.
Some of the improvement in economic confidence in 2012 could be because of the political calendar, with Democratic confidence surging while President Obama sought re-election. As the election fades into the background, there may be a weaker connection between politics and economic confidence moving forward.
If economic confidence is less colored by politics than was the case this year, economic events may prove more important in determining the future course of U.S. economic confidence. Thus, the performance of the stock market, future reports on unemployment and economic growth, and perhaps more immediately, the fate of the fiscal cliff budget measures, may cause Americans' to become increasingly more, or increasingly less, confident in the U.S. economy in the coming weeks and months.
Gallup.com reports results from these indexes in daily, weekly, and monthly averages and in Gallup.com stories. Complete trend data are always available to view and export in the following charts:
Daily: Employment, Economic Confidence, Job Creation, Consumer Spending
Weekly: Employment, Economic Confidence, Job Creation, Consumer Spending
Read more about Gallup's economic measures.
View our economic release schedule.
Survey Methods
Results are based on telephone interviews conducted as part of the Gallup Daily tracking survey Nov. 1-30, 2012, with a random sample of 14,187 adults, aged 18 and older, living in all 50 U.S. states and the District of Columbia, selected using random-digit-dial sampling.
For results based on the total sample of national adults, one can say with 95% confidence that the maximum margin of sampling error is ±1 percentage point.
Interviews are conducted with respondents on landline telephones and cellular phones, with interviews conducted in Spanish for respondents who are primarily Spanish-speaking. Each sample includes a minimum quota of 400 cellphone respondents and 600 landline respondents per 1,000 national adults, with additional minimum quotas among landline respondents by region. Landline telephone numbers are chosen at random among listed telephone numbers. Cellphone numbers are selected using random-digit-dial methods. Landline respondents are chosen at random within each household on the basis of which member had the most recent birthday.
Samples are weighted by gender, age, race, Hispanic ethnicity, education, region, adults in the household, and phone status (cellphone only/landline only/both, cellphone mostly, and having an unlisted landline number). Demographic weighting targets are based on the March 2011 Current Population Survey figures for the aged 18 and older non-institutionalized population living in U.S. telephone households. All reported margins of sampling error include the computed design effects for weighting and sample design.
The questions reported here were asked of a random half-sample of respondents each night on the Gallup Daily tracking survey.
In addition to sampling error, question wording and practical difficulties in conducting surveys can introduce error or bias into the findings of public opinion polls.
For more details on Gallup's polling methodology, visit https://www.gallup.com/.
