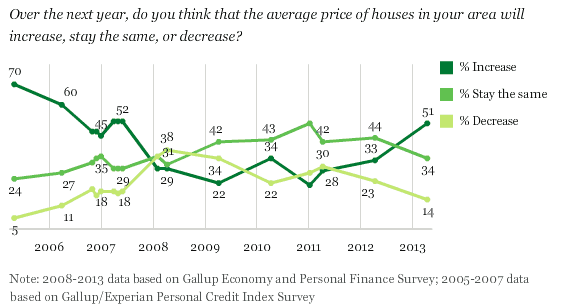
PRINCETON, NJ -- Fifty-one percent of Americans expect average home prices in their local area to increase over the next year, a sharp increase from last year and the first time it has been above 50% since 2007.
These data are from Gallup's annual Economy and Personal Finance survey, conducted April 4-14, polling more than 2,000 Americans and 1,400 homeowners on the topic of housing. This is the first of several stories on housing and homeownership Gallup will run this week, as part of Gallup's ongoing series, "The New American Consumer."
Americans' views of the housing market became understandably more pessimistic during the housing crisis and its aftermath. But with the housing market picking up again, so has Americans' optimism about home prices. Gallup first asked about expectations for local home values in an Experian/Gallup Personal Credit Index survey in 2005, and at that point -- near the peak of the housing market -- 70% expected local home prices to rise.
Americans' optimism waned in subsequent updates on the question, with the percentages expecting home price increases hovering near 50% in late 2006 and 2007 before plummeting to 29% in January 2008. Expectations of an increase stayed low until this year's surge to 51%.
BIG TRENDS: Read more in our on going series The New American Consumer
Western Residents Optimistic About Home Value Increase
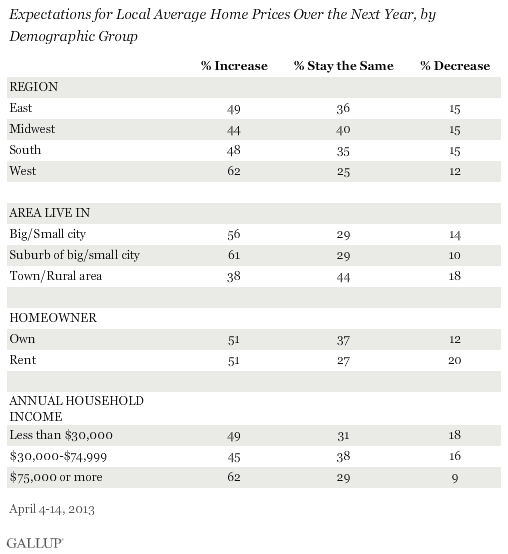
Residents of the Western part of the country are most optimistic about home values, with 62% expecting prices to increase. In other regions of the country, just under half expect home values to increase. Also, those who describe their residence as being in a city or suburban area are much more optimistic about home values than are those who say they live in a "town" or "rural area."
Homeowners are no more optimistic than renters about housing prices, but upper-income Americans are more likely to expect values to increase than are middle- and lower-income Americans.
Homeowners More Likely Now to Say Home Value Exceeds Purchase Price
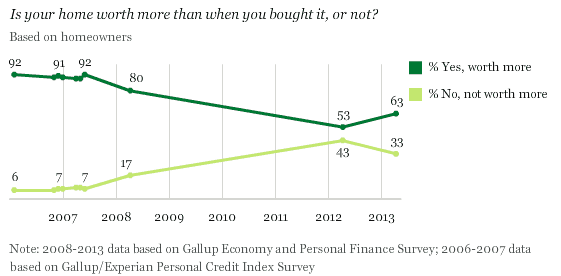
For many Americans, a home is not just a place to live but also one of their biggest financial investments. But the housing crisis left many -- particularly those who bought near the top of the market -- with a house worth less than they paid for it. In fact, last year 53% of U.S. homeowners said their house was worth more than they paid for it, down from 80% in 2008 and more than 90% in 2006.
This year, 63% of homeowners say their house is worth more than when they bought it, providing evidence of a recovery in home values, although still not back to levels of five or more years ago.
Younger homeowners, many of whom probably bought homes fairly recently, appear to be more affected by the recent downturn in home prices. Fifty-two percent of homeowners younger than 50 say their home is worth more than when they bought it, compared with 71% of homeowners aged 50 and older.
In addition to age, there are modest differences by region and income. Homeowners living in the East are more likely than those residing in other parts of the country to say their home is worth more than when they bought it. And upper-income homeowners are more likely than lower-income homeowners to say the same.
Americans Continue to Say It Is a Good Time to Buy Homes
Even as Americans did not expect home prices to increase in recent years, they still generally believed it was a good time to buy a house, though the housing crisis clearly affected their views from 2006-2008. Currently, 73% say it is a good time to buy, the highest since 2003, albeit not much different from results since 2009. In 2003, a record 81% said it was a good time to buy a house.
Even during the depths of the housing crisis, the "good time" percentage never fell below 50%, indicating that Americans' opinions may take into account factors other than whether the housing market is strong. For example, when prices dropped, Americans may still have believed it was a good time to buy a home because lower home prices provided a favorable buying opportunity. Also, regardless of market conditions, Americans may generally just believe buying a home is a good thing to do.
Because there is presently a large consensus about the desirability of buying a home, there are few notable differences by subgroup. One exception is by income -- 87% of those whose annual income is $75,000 or more believe it is a good time to buy a house, compared with 55% of those whose income is less than $30,000. Middle-income respondents, at 76%, fall closer to the views of upper-income Americans.
Implications
Americans are as bullish on the housing market as they have been at any time since before the housing bubble burst several years ago. This surely reflects the stabilization of the housing market, and the fact that home prices are generally heading up in most parts of the country. Upper-income Americans are especially positive about the home buying market.
Still, the effects of the housing slump have not completely vanished. Although the percentage of Americans saying their home is worth more than when they bought it is up significantly from last year, it remains well below prior levels. Younger homeowners in particular are struggling to see a return on their initial investment.
Many economists expect the strong housing market to continue this year, as the conditions that led to last year's gains -- low interest rates and more demand than supply for houses -- remain in place.
Gallup will continue its series on housing this week, looking at the psychology behind owning versus renting, as well as homeowners' and renters' intentions for selling and buying in the near future.
Survey Methods
Results for this Gallup poll are based on telephone interviews conducted April 4-14, 2013, with a random sample of 2,017 adults, aged 18 and older, living in all 50 U.S. states and the District of Columbia.
For results based on the total sample of national adults, one can say with 95% confidence that the margin of sampling error is ±3 percentage points.
For results based on the total sample of 1,426 homeowners, one can say with 95% confidence that the margin of sampling error is ±3 percentage points.
Interviews are conducted with respondents on landline telephones and cellular phones, with interviews conducted in Spanish for respondents who are primarily Spanish-speaking. Each sample of national adults includes a minimum quota of 50% cellphone respondents and 50% landline respondents, with additional minimum quotas by region. Landline telephone numbers are chosen at random among listed telephone numbers. Cellphone numbers are selected using random digit dial methods. Landline respondents are chosen at random within each household on the basis of which member had the most recent birthday.
Samples are weighted to correct for unequal selection probability, nonresponse, and double coverage of landline and cell users in the two sampling frames. They are also weighted to match the national demographics of gender, age, race, Hispanic ethnicity, education, region, population density, and phone status (cellphone only/landline only/both, cellphone mostly, and having an unlisted landline number). Demographic weighting targets are based on the March 2012 Current Population Survey figures for the aged 18 and older U.S. population. Phone status targets are based on the July-December 2011 National Health Interview Survey. Population density targets are based on the 2010 census. All reported margins of sampling error include the computed design effects for weighting.
In addition to sampling error, question wording and practical difficulties in conducting surveys can introduce error or bias into the findings of public opinion polls.
View methodology, full question results, and trend data.
For more details on Gallup's polling methodology, visit www.gallup.com.
