PRINCETON, NJ -- U.S. retirees are consistently more likely than nonretirees to report having enough money to live comfortably. This year, 75% of retirees versus 67% of nonretirees say they are financially comfortable right now. Since 2002, the average gap has been 10 percentage points in favor of retirees.
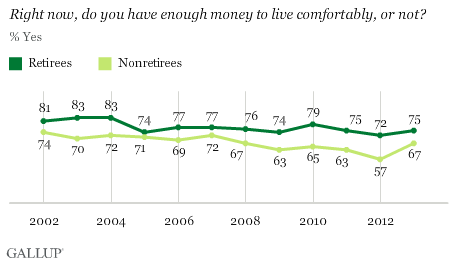
Gallup asks this question each year in its Economy and Personal Finance survey. Overall, 68% of Americans say they have enough money to live comfortably right now. That number is up from the 12-year low registered last year, which also included lows for both retirees and nonretirees.
These data are based on self-reports of financial comfort, meaning that two respondents with similar incomes or expenses may not respond to the question in the same way.
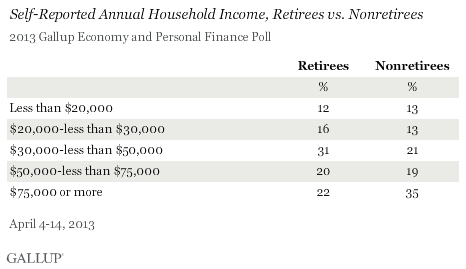
But one thing is clear, household income does not explain retirees' greater likelihood of saying they are financially comfortable. Nonretirees are significantly more likely to report annual household incomes of $75,000 or higher. Retirees are more likely to fall in the $30,000 to less than $50,000 range, while the two groups have similar percentages in the other income categories.
Retirees (57%) are more likely than nonretirees (51%) to have stock investments, but the differences are fairly small and not enough to offset the larger differences in income.
Rather, retirees may report a more financially comfortable situation because they have lower average expenses than nonretirees do. Gallup does not collect data in an attempt to obtain Americans' average expenses, but other information in the poll indicates having lower average expenses may affect retirees and nonretirees views on their financial situations.
First, relatively few retirees are supporting young children. Only 4% say they have children younger than 18, compared with 39% of nonretirees. Gallup's self-reported spending data consistently show that 30- to 49-year-olds -- by far the most likely to have young children -- consistently report the highest levels of spending.
Additionally, retirees (84%) are much more likely than nonretirees (56%) to own their home. While homeownership incurs many expenses such as property taxes and home repairs and maintenance, a proportion of retirees likely own their home outright, greatly reducing their housing costs by not paying a mortgage every month.
Retirees are also more likely to be married (61%) than nonretirees (50%). Having a spouse could mean a second source of income, either through being married to someone who is still working or having an additional pension, Social Security payment, or source of retirement income to cover household expenses.
Another possibility for reporting having enough money to live comfortably is that retirees may have a more frugal lifestyle than nonretirees. The poll, however, does not show significant differences in spending versus saving preferences among retirees and nonretirees: 60% of retirees and 61% of nonretirees say they enjoy saving more than they do spending.
Implications
Although many may think of retirees as struggling to make ends meet on fixed incomes, retirees themselves are more likely than nonretirees to say they have enough money to live comfortably. This is true even though retirees generally report lower household incomes than nonretirees.
This pattern has been consistent throughout the 12 years Gallup has asked about financial comfort, although it is not clear if the trend will continue in the future. Even though they lag behind current retirees, today's nonretirees are even more pessimistic about their financial situation when they retire. Whereas 67% of nonretirees say they are comfortable now, 46% predict they will be financially comfortable in retirement. Nonretirees who are older than 30 are especially likely to be pessimistic about their future financial situation.
It is possible today's nonretirees will find their financial situation better in retirement than they expect, but it may also be that their expectations will be realized given the uncertainty of Social Security, a lack of sufficient retirement savings for many nonretirees, and rising healthcare costs. Indeed, retirement savings ranks as Americans' No. 1 financial worry.
Gallup has seen a drop in the percentage of retirees today who say they are financially comfortable compared with what it measured in 2002, the first year Gallup asked the question. But, nonretirees show a similar decline in financial comfort levels, possibly reflecting the relative health of the economy then versus now.
Survey Methods
Results for this Gallup poll are based on telephone interviews conducted April 11-14, 2013, with a random sample of 1,012 adults, aged 18 and older, living in all 50 U.S. states and the District of Columbia.
For results based on the total sample of national adults, one can say with 95% confidence that the margin of sampling error is ±4 percentage points.
For results based on the total sample of 318 retirees, one can say with 95% confidence that the margin of sampling error is ±7 percentage points.
For results based on the total sample of 694 nonretirees, one can say with 95% confidence that the margin of sampling error is ±5 percentage points.
Interviews are conducted with respondents on landline telephones and cellular phones, with interviews conducted in Spanish for respondents who are primarily Spanish-speaking. Each sample of national adults includes a minimum quota of 50% cellphone respondents and 50% landline respondents, with additional minimum quotas by region. Landline telephone numbers are chosen at random among listed telephone numbers. Cellphone numbers are selected using random digit dial methods. Landline respondents are chosen at random within each household on the basis of which member had the most recent birthday.
Samples are weighted to correct for unequal selection probability, nonresponse, and double coverage of landline and cell users in the two sampling frames. They are also weighted to match the national demographics of gender, age, race, Hispanic ethnicity, education, region, population density, and phone status (cellphone only/landline only/both, cellphone mostly, and having an unlisted landline number). Demographic weighting targets are based on the March 2012 Current Population Survey figures for the aged 18 and older U.S. population. Phone status targets are based on the July-December 2011 National Health Interview Survey. Population density targets are based on the 2010 census. All reported margins of sampling error include the computed design effects for weighting.
In addition to sampling error, question wording and practical difficulties in conducting surveys can introduce error or bias into the findings of public opinion polls.
For more details on Gallup's polling methodology, visit www.gallup.com.
