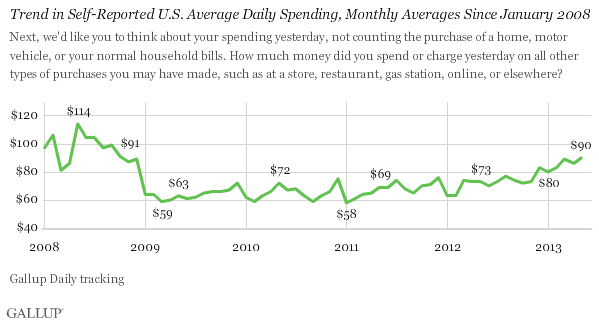
WASHINGTON, D.C. -- Americans' self-reported daily spending rose to an average of $90 in May, the highest since October 2008 and higher than it has been in May since the $114 found in the same month in 2008. Spending is up from $86 in April and on par with the $89 found in March.
These results are based on Gallup Daily tracking interviews, conducted by landline and cellphone, with more than 15,000 Americans from May 1-31.
Americans' spending climbed into the $80-per-day range last December and has stayed at or above that level after hovering in the low $70 range through most of 2012. The May 2008 figure of $114 per day is the highest average spending figure Gallup has found in any month since it started tracking spending daily in January 2008. Spending fell into the low $60 range in 2009, amid the economic downturn, sinking to $59 in March of that year.
Spending Up Across Income Groups
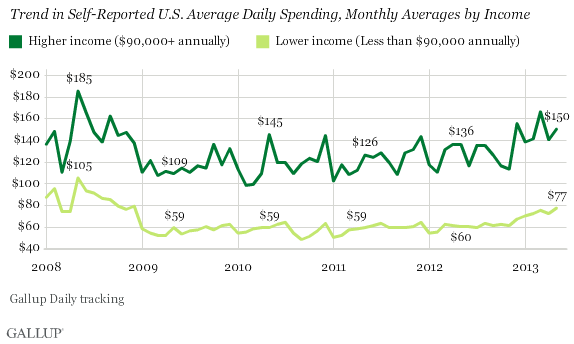
Upper-income and lower-income Americans' spending increased in May, and the current levels for both groups surpass what Gallup found in May of the past three years. However, the average of $150 upper-income Americans spent daily in May remains lower than the $185 this group reported in May 2008. The same is true for the average $77 that lower-income Americans spent daily in May -- it is not as high as the $105 they spent in May 2008. Each May 2008 figure is the record monthly high for the income category in Gallup Daily tracking.
Bottom Line
Several of Gallup's economic indicators are pointing to improving conditions in May -- economic confidence, job creation, and consumer spending are all up and at their highest levels in about five years. But Americans' spending is not yet back to levels seen for much of 2008, before the financial crisis and the extended period of lower, "new normal" spending from 2009-2012. The 2013 spending figures suggest the new normal period may be ending, and with the health of the U.S. economy so dependent on consumer spending, the increase is a hopeful sign for an economic recovery.
Even so, one indicator points to a still-struggling economy -- Gallup's Payroll to Population rate. It worsened to 43.9% in May and remains lower than it was in May of last year, meaning fewer Americans are working full time for an employer now than a year ago. The lack of recovery in this metric could be one of the reasons spending has yet to return to the more robust levels of early 2008.
Gallup.com reports results from these indexes in daily, weekly, and monthly averages and in Gallup.com stories. Complete trend data are always available to view and export in the following charts:
Daily: Employment, Economic Confidence, Job Creation, Consumer Spending
Weekly: Employment, Economic Confidence, Job Creation, Consumer Spending
Read more about Gallup's economic measures.
View our economic release schedule.
Survey Methods
Results are based on telephone interviews conducted as part of Gallup Daily tracking May 1-31, 2013, with a random sample of 15,790 adults, aged 18 and older, living in all 50 U.S. states and the District of Columbia.
For results based on the total sample of employed adults, one can say with 95% confidence that the margin of sampling error is ±1 percentage point.
Interviews are conducted with respondents on landline telephones and cellular phones, with interviews conducted in Spanish for respondents who are primarily Spanish-speaking. Each sample of national adults includes a minimum quota of 50% cellphone respondents and 50% landline respondents, with additional minimum quotas by region. Landline telephone numbers are chosen at random among listed telephone numbers. Cellphone numbers are selected using random digit dial methods. Landline respondents are chosen at random within each household on the basis of which member had the most recent birthday.
Samples are weighted to correct for unequal selection probability, nonresponse, and double coverage of landline and cell users in the two sampling frames. They are also weighted to match the national demographics of gender, age, race, Hispanic ethnicity, education, region, population density, and phone status (cellphone only/landline only/both, cellphone mostly, and having an unlisted landline number). Demographic weighting targets are based on the March 2012 Current Population Survey figures for the aged 18 and older U.S. population. Phone status targets are based on the July-December 2011 National Health Interview Survey. Population density targets are based on the 2010 census. All reported margins of sampling error include the computed design effects for weighting.
In addition to sampling error, question wording and practical difficulties in conducting surveys can introduce error or bias into the findings of public opinion polls.
For more details on Gallup's polling methodology, visit www.gallup.com.
