PRINCETON, NJ -- Two-thirds of Americans believe college applicants should be admitted solely based on merit, even if that results in few minorities being admitted, while 28% believe an applicant's racial and ethnic background should be taken into account to promote diversity on college campuses. Three-quarters of whites and 59% of Hispanics believe applicants should be judged only on merit, while blacks are divided in their views.
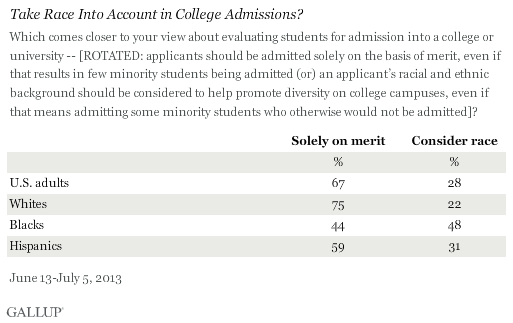
The Supreme Court has heard cases that challenged affirmative action programs in college admissions in recent years. In 2003, it declared unconstitutional the University of Michigan's undergraduate admissions process that automatically awarded minority applicants extra "points" in its admissions formula, but upheld the university's law school admissions process that took race into account more generally when evaluating each individual applicant. This year, it vacated and remanded a lower-court ruling on a challenge to the University of Texas' admissions program from a white applicant denied admission.
Gallup has asked about using race in college admissions decisions twice before, in 2003 just prior to the ruling in the University of Michigan case, and again in 2007. Americans' opinions have been quite stable over the past 10 years.
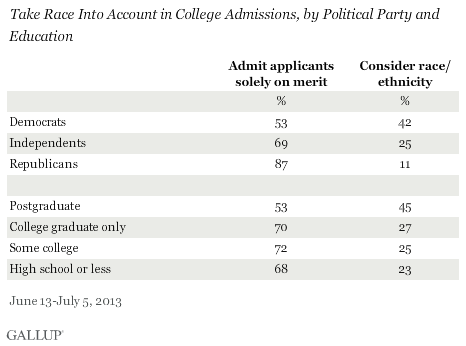
Aside from blacks, a majority of all other major subgroups believe colleges should determine admissions solely on merit. But the percentage holding that view varies. For example, 87% of Republicans and 53% of Democrats prefer race-neutral admissions decisions. Also, those with postgraduate education are much more willing to have schools consider race and ethnicity in admissions than are those with less formal education.
Americans Support Affirmative Action in General
Even though Americans largely reject the idea of using race as a factor in college admissions, they still support affirmative action programs more generally. A separate question in the poll finds 58% of Americans saying they favor "affirmative action programs for racial minorities," including 51% of whites, 76% of blacks, and 69% of Hispanics.
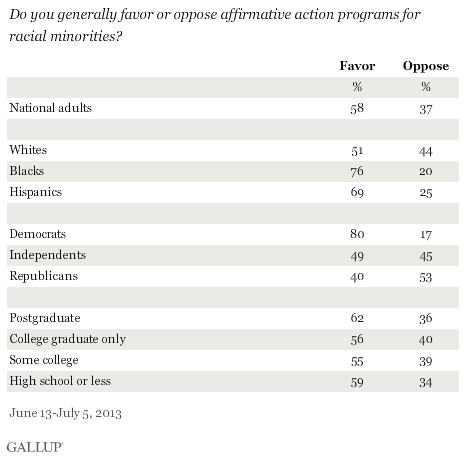
There are large partisan differences in support for affirmative action -- Democrats are twice as likely as Republicans to favor affirmative action programs. Republicans are one of only a few groups that show majority opposition. Whereas there were significant differences by education with regard to college admissions, there are only minor differences with regard to affirmative action programs in general.
Americans may be less likely to support affirmative action in college admissions because the question raises a potential specific consequence of such programs -- admitting some minority students who would otherwise not be admitted on their merits alone -- which could in their minds outweigh the positive aspects of the policy mentioned in the question. The general question on affirmative action, asked prior to the question on college admissions, does not discuss any pros or cons of affirmative action, suggesting Americans mostly have a positive reaction to the concept or term.
Racial Groups Differ on Government Role in Helping Minorities
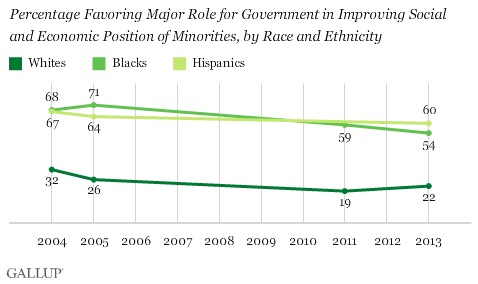
Americans support the government's playing at least a minor role in trying to improve the social and economic position of blacks and other minority groups in the U.S., with 32% favoring a major government role and 44% a minor one. However, white Americans generally favor a minor government role, while most blacks and Hispanics prefer more significant government involvement.
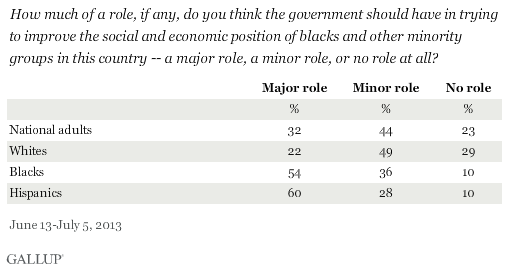
The substantial racial differences have always been apparent in this question. But whites are now less likely to favor a major government role in assisting minorities than they were during the Bush administration. Blacks, though still supportive of a major government role, are also a bit less likely now than they were in 2004-2005 to think that. As a result, Hispanics now edge out blacks as the group most likely to favor a major government role in aiding minorities.
Implications
Americans are not averse to having the government take steps to help improve the conditions of minority groups in the United States, and in a broad sense express support for affirmative action programs. One of the clearest examples of affirmative action in practice is colleges' taking into account a person's racial or ethnic background when deciding which applicants will be admitted. Americans seem reluctant to endorse such a practice, and even blacks, who have historically been helped by such programs, are divided on the matter.
The Supreme Court has ruled some college admissions practices unconstitutional for violating the guarantee of equal protection under the law. But the Court also said affirmative action in college admissions is permissible if it stands up to "strict scrutiny," agreeing that the goal of a diverse student body is worthy but race should be one of many factors taken into account rather than being a determining factor.
The recent University of Texas case suggests the issue is far from settled, and individuals denied admission may continue to go to court to challenge admissions procedures at other schools to see if their programs appropriately balance equal protection under the law versus achieving the goals of a diverse student body and helping raise the economic position of minorities.
Survey Methods
Results for this Gallup poll are based on telephone interviews conducted June 13-July 5, 2013, with a random sample of 4,373 adults, aged 18 and older, living in all 50 U.S. states and the District of Columbia, including oversamples of black and Hispanic adults. The total sample is weighted to represent racial and ethnic groups proportionately to their share of the population. All respondents had previously been interviewed for the Gallup Daily tracking survey.
For results based on the total sample of national adults, one can say with 95% confidence that the margin of sampling error is ±2 percentage points.
For results based on the total sample of 2,149 non-Hispanic whites, one can say with 95% confidence that the margin of sampling error is ±3 percentage points.
For results based on the total sample of 1,010 non-Hispanic blacks, one can say with 95% confidence that the margin of sampling error is ±5 percentage points.
For results based on the total sample of 1,000 Hispanics, one can say with 95% confidence that the margin of sampling error is ±6 percentage points.
Interviews are conducted with respondents on landline telephones and cellular phones, with interviews conducted in Spanish for respondents who are primarily Spanish-speaking. Each sample of national adults includes a minimum quota of 50% cell phone respondents and 50% landline respondents, with additional minimum quotas by region. Landline and cell phone numbers are selected using random digit dial methods. Landline respondents are chosen at random within each household on the basis of which member had the most recent birthday.
Samples are weighted to correct for unequal selection probability, nonresponse, and double coverage of landline and cell users in the two sampling frames. They are also weighted to match the national demographics of gender, age, race, Hispanic ethnicity, education, region, population density, and phone status (cellphone only/landline only/both, and being cellphone mostly). Demographic weighting targets are based on the March 2012 Current Population Survey figures for the aged 18 and older U.S. population. Phone status targets are based on the July-December 2011 National Health Interview Survey. Population density targets are based on the 2010 census. All reported margins of sampling error include the computed design effects for weighting.
In addition to sampling error, question wording and practical difficulties in conducting surveys can introduce error or bias into the findings of public opinion polls.
View methodology, full question results, and trend data.
For more details on Gallup's polling methodology, visit www.gallup.com.
