GALLUP NEWS SERVICE
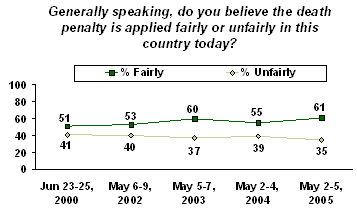
PRINCETON, NJ -- Gallup's annual Moral Values and Beliefs poll finds that Americans are more positive in their orientation toward the death penalty than they have been in the past several years. Across a wide range of questions on the topic, Americans show a slight but noticeable increase in death penalty support. Compared with a year ago, more Americans say they support the death penalty as punishment for murder, more choose it over life imprisonment as the preferred punishment for murder, and more Americans believe the death penalty is applied fairly in this country.
Additionally, a majority of Americans now say the death penalty is not imposed often enough. There has also been a significant decline since 2003 in the percentage who believe that innocent people have been executed under the death penalty in the past five years. The increase in support for the death penalty is apparent across most societal subgroups.
Basic Support for the Death Penalty
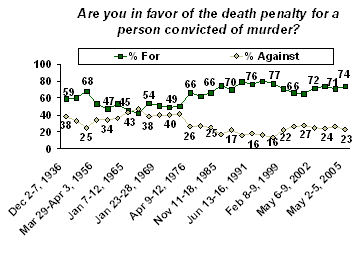
The May 2-5, 2005, Gallup Poll finds 74% of Americans saying they favor the death penalty for a person convicted of murder, while 23% are not in favor. That represents a recent high in support, tied with a 74% reading in May 2003. Gallup has asked this version of the death penalty question since 1936, with a high water mark in support of 80% in 1994, and a low of 42% in 1966.
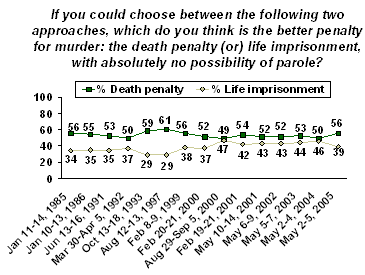
A second question on death penalty support -- asking respondents whether the death penalty or life imprisonment with no possibility of parole is the better penalty for murder -- also shows an increase in pro-death penalty sentiment. Fifty-six percent of Americans say the death penalty is the better punishment, while 39% choose life imprisonment. The last time support for the death penalty was this high was in 1999, when 56% also said they preferred that option. The highest support for the death penalty that Gallup has measured on this question (dating back to 1985) was 61% in August 1997.
By a nearly two-to-one margin, men say they prefer the death penalty (65%) to life imprisonment (33%). Women, however, are about equally divided in their views, with 47% preferring the death penalty and 46% life imprisonment. This gender gap has been evident in previous years, but both groups are more likely to favor the death penalty this year than in the past.
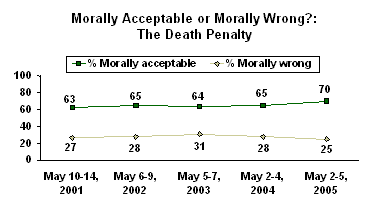
Consistent with their basic support for the use of the death penalty, 70% of Americans say it is "morally acceptable," while 25% say it is "morally wrong." From 2001-2004, a lower percentage of Americans -- between 63% and 65% -- considered the death penalty morally acceptable.
Application of the Death Penalty
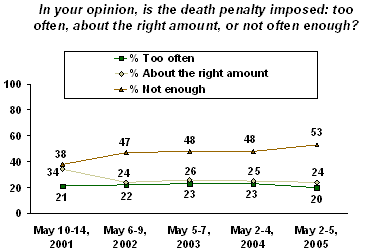
For the first time since Gallup began asking about the application of the death penalty in 2001, a majority of Americans say the death penalty is not imposed often enough. Fifty-three percent hold this view, while 24% say it is imposed the right amount of time, and 20% say it is imposed too often. Last year, 48% said the death penalty was not imposed often enough, 25% the right amount of time, and 23% too often. In 2001, public opinion on this matter was very different. At that time, just 38% said the death penalty was not used enough, 34% said the right amount of time, and 21% too often.
Sixty-one percent say that, generally speaking, the death penalty is applied fairly in the United States today, while 35% say it is applied unfairly. In 2003, 60% also said the death penalty was applied fairly, but in other years the percentage has been in the low-to-mid 50% range.
One possible reason for the increase in support for the death penalty is a declining belief that innocent people are being executed. Gallup finds a significant decrease in the percentage of Americans who believe that, in the past five years, innocent people have been executed under the death penalty -- from 73% in May 2003 to 59% this year.
At the beginning of the decade, several death row inmates whose cases were reopened were found to be not guilty of the crime for which they received the death penalty. This led the state of Illinois -- where many of those cases occurred -- to institute a moratorium on executions, which remains in effect today. Maryland also imposed a moratorium in 2002, which has since been lifted.
Most Americans believe that executions of innocent people are rare -- two in three believe this has happened in 5% or fewer cases in the last five years, including one-third who say it has not happened at all. Only 6% believe it has happened in more than 20% of the cases -- less than half the percentage who said this in 2003 (13%).
How often do you think that a person has been executed under the death penalty who was, in fact, innocent of the crime he or she was charged with -- do you think this has happened in the past five years, or not?[IF YES:] Just your best guess, about what percent of people who are executed under the death penalty are really innocent of the crime they were charged with?
|
2005 May 2-5 |
2003 May 5-7 |
|
|
|
|
|
|
None/Has not happened |
33 |
22 |
|
1-5% |
34 |
40 |
|
6-10% |
8 |
9 |
|
11-20% |
6 |
6 |
|
21-50% |
5 |
11 |
|
More than 50% |
1 |
2 |
|
|
|
|
|
No opinion |
13 |
10 |
|
|
|
|
|
Mean |
6.6% |
8.8% |
|
Median |
1% |
2% |
Variations in Death Penalty Support
In its long history of polling on the death penalty, Gallup has consistently found that different groups are more or less likely to favor the death penalty. Those differences are apparent this year, as well. The following table shows the percentage of each group who finds the death penalty morally acceptable, comparing it to last year and reporting any change. In general, most groups show a slight increase in death penalty support compared with last year.
|
View of Death Penalty as Morally Acceptable or Morally Wrong, by Subgroup |
|||
|
|
|
|
|
|
Group |
% Morally acceptable, 2004 |
% Morally acceptable, 2005 |
Change |
|
|
|
|
|
|
% |
% |
|
|
|
All Americans |
65 |
70 |
+5 |
|
|
|
|
|
|
Men |
72 |
79 |
+7 |
|
Women |
59 |
61 |
+2 |
|
|
|
|
|
|
White |
70 |
73 |
+3 |
|
Non-white |
45 |
58 |
+13 |
|
|
|
|
|
|
18-29 years old |
69 |
64 |
-5 |
|
30-49 years old |
71 |
74 |
+3 |
|
50-64 years old |
61 |
69 |
+8 |
|
65 years and older |
57 |
67 |
+10 |
|
|
|
|
|
|
High school education or less |
67 |
72 |
+5 |
|
Some college education |
73 |
71 |
-2 |
|
Four-year college graduate |
61 |
69 |
+8 |
|
Post-graduate education |
53 |
61 |
+8 |
|
|
|
|
|
|
Household income less than $30,000 |
57 |
67 |
+10 |
|
Household income $30,000-$74,999 |
70 |
70 |
0 |
|
Household income $75,000 or more |
69 |
73 |
+4 |
|
|
|
|
|
|
Liberal |
47 |
59 |
+12 |
|
Moderate |
66 |
70 |
+4 |
|
Conservative |
74 |
75 |
+1 |
|
|
|
|
|
|
Democrat |
53 |
59 |
+6 |
|
Independent |
68 |
71 |
+3 |
|
Republican |
77 |
79 |
+2 |
|
|
|
|
|
|
Attend church weekly |
61 |
63 |
+2 |
|
Attend nearly weekly/monthly |
62 |
69 |
+7 |
|
Seldom/never attend church |
72 |
75 |
+3 |
|
|
|
|
|
|
Protestant |
66 |
69 |
+3 |
|
Catholic |
69 |
70 |
+1 |
To summarize the major differences in subgroup support:
- Men are much more likely to find the death penalty morally acceptable than women.
- Whites are more supportive of capital punishment than non-whites.
- Those with a post-graduate education are slightly less supportive of the death penalty than people with lower levels of education.
- Conservatives are much more likely to view the death penalty more morally acceptable than are liberals.
- Likewise, Republicans are much more pro-death penalty than Democrats.
- People who attend church or religious services on a regular basis are less likely to support the death penalty than those who seldom or never attend.
Survey Methods
These results are based on telephone interviews with a randomly selected national sample of 1,005 adults, aged 18 and older, conducted May 2-5, 2005. For results based on this sample, one can say with 95% confidence that the maximum error attributable to sampling and other random effects is ±3 percentage points. In addition to sampling error, question wording and practical difficulties in conducting surveys can introduce error or bias into the findings of public opinion polls.
19. Are you in favor of the death penalty for a person convicted of murder?
|
For |
Against |
No opinion |
|
|
% |
% |
% |
|
|
2005 May 2-5 ^ |
74 |
23 |
3 |
|
2004 Oct 11-14 |
64 |
31 |
5 |
|
2004 May 2-4 ^ |
71 |
26 |
3 |
|
2003 Oct 6-8 |
64 |
32 |
4 |
|
2003 May 19-21 |
70 |
28 |
2 |
|
2003 May 5-7 ^ |
74 |
24 |
2 |
|
2002 Oct 14-17 |
70 |
25 |
5 |
|
2002 May 6-9 ^ |
72 |
25 |
3 |
|
2001 Oct 11-14 |
68 |
26 |
6 |
|
2001 May 10-14 ^ |
65 |
27 |
8 |
|
2001 Feb 19-21 ^ |
67 |
25 |
8 |
|
2000 Aug 29-Sep 5 |
67 |
28 |
5 |
|
2000 Jun 23-25 |
66 |
26 |
8 |
|
2000 Feb 14-15 |
66 |
28 |
6 |
|
1999 Feb 8-9 |
71 |
22 |
7 |
|
1995 May 11-14 |
77 |
13 |
10 |
|
1994 Sep 6-7 |
80 |
16 |
4 |
|
1991 Jun 13-16 |
76 |
18 |
6 |
|
1988 Sep 25-Oct 1 |
79 |
16 |
5 |
|
1988 Sep 9-11 |
79 |
16 |
5 |
|
1986 Jan 10-13 |
70 |
22 |
8 |
|
1985 Jan 11-14 |
72 |
20 |
8 |
|
1985 Nov 11-18 |
75 |
17 |
8 |
|
1981 Jan 30-Feb 2 |
66 |
25 |
9 |
|
1978 Mar 3-6 |
62 |
27 |
11 |
|
1976 Apr 9-12 |
66 |
26 |
8 |
|
1972 Nov 10-13 |
57 |
32 |
11 |
|
1972 Mar 3-5 |
50 |
41 |
9 |
|
1971 Oct 29-Nov 2 |
49 |
40 |
11 |
|
1969 Jan 23-28 |
51 |
40 |
9 |
|
1967 Jun 2-7 |
54 |
38 |
8 |
|
1966 May 19-24 |
42 |
47 |
11 |
|
1965 Jan 7-12 |
45 |
43 |
12 |
|
1960 Mar 2-7 |
53 |
36 |
11 |
|
1957 Aug 29-Sep 4 |
47 |
34 |
18 |
|
1956 Mar 29-Apr 3 |
53 |
34 |
13 |
|
1953 Nov 1-5 |
68 |
25 |
7 |
|
1937 Dec 1-6 |
60 |
33 |
7 |
|
1936 Dec 2-7 |
59 |
38 |
3 |
|
|
|
|
|
|
^ Based on half sample |
|||
20. If you could choose between the following two approaches, which do you think is the better penalty for murder -- [ROTATED: the death penalty (or) life imprisonment, with absolutely no possibility of parole]?
|
The death |
Life |
No |
|
|
% |
% |
% |
|
|
2005 May 2-5 ^ |
56 |
39 |
5 |
|
2004 May 2-4 ^ |
50 |
46 |
4 |
|
2003 May 5-7 ^ |
53 |
44 |
3 |
|
2002 May 6-9 ^ |
52 |
43 |
5 |
|
2001 May 10-14 ^ |
52 |
43 |
5 |
|
2001 Feb 19-21 ^ |
54 |
42 |
4 |
|
2000 Aug 29-Sep 5 ^ |
49 |
47 |
4 |
|
2000 Feb 20-21 |
52 |
37 |
11 |
|
1999 Feb 8-9 ^ |
56 |
38 |
6 |
|
1997 Aug 12-13 ^ |
61 |
29 |
10 |
|
1993 Oct 13-18 |
59 |
29 |
12 |
|
1992 Mar 30-Apr 5 |
50 |
37 |
13 |
|
1991 Jun 13-16 |
53 |
35 |
11 |
|
1986 Jan 10-13 |
55 |
35 |
10 |
|
1985 Jan 11-14 |
56 |
34 |
10 |
|
|
|
|
|
|
^ Based on half sample |
|||
21. In your opinion, is the death penalty imposed -- [ROTATED: too often, about the right amount, or not often enough]?
|
|
About the |
|
|
|
|
% |
% |
% |
% |
|
|
2005 May 2-5 |
20 |
24 |
53 |
3 |
|
2004 May 2-4 |
23 |
25 |
48 |
4 |
|
2003 May 5-7 |
23 |
26 |
48 |
3 |
|
2002 May 6-9 |
22 |
24 |
47 |
7 |
|
2001 May 10-14 |
21 |
34 |
38 |
7 |
22. Generally speaking, do you believe the death penalty is applied fairly or unfairly in this country today?
|
Fairly |
Unfairly |
No opinion |
|
|
% |
% |
% |
|
|
2005 May 2-5 |
61 |
35 |
4 |
|
2004 May 2-4 |
55 |
39 |
6 |
|
2003 May 5-7 |
60 |
37 |
3 |
|
2002 May 6-9 |
53 |
40 |
7 |
|
2000 Jun 23-25 |
51 |
41 |
8 |
23. How often do you think that a person has been executed under the death penalty who was, in fact, innocent of the crime he or she was charged with -- do you think this has happened in the past five years, or not?
|
Yes, in past five years |
No, not |
No |
|
|
2005 May 2-5 |
59% |
33 |
8 |
|
2003 May 5-7 |
73% |
22 |
5 |
24. Just your best guess, about what percent of people who
are executed under the death penalty are really innocent of the
crime they were charged with?
[Based on adults who say someone has been executed
under the death penalty in the past five years who was innocent of
the crime]
|
2005 May 2-5 |
2003 May 5-7 |
|
|
% |
% |
|
|
None |
-- |
* |
|
1-5% |
57 |
55 |
|
6-10% |
14 |
13 |
|
11-20% |
10 |
8 |
|
21-50% |
9 |
15 |
|
More than 50% |
2 |
2 |
|
|
|
|
|
No opinion |
8 |
7 |
|
|
|
|
|
Mean |
10.7% |
11.7% |
|
Median |
5% |
5% |
|
* Less than 0.5% |
||
