WASHINGTON, D.C. -- Young adults, nonwhites, and the low-income in the U.S. drink more regular soda than other Americans. Half of Americans aged 18 to 29 say they drink regular soda, making them the most likely to do so across not only age groups, but also across all major demographic and socioeconomic groups. Nonwhites (46%) and low-income Americans (45%) -- two groups among the most likely to be obese -- follow just behind the young in regular soda consumption.
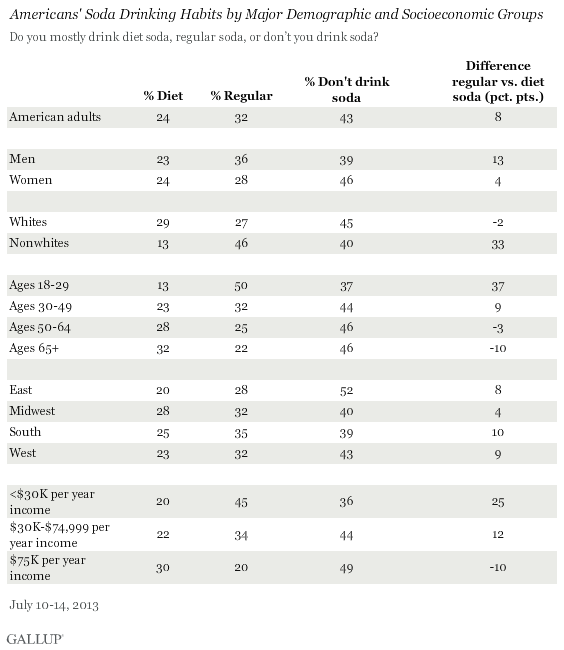
Diet soda consumption increases with age and as income rises, with seniors and those making $75,000 or more annually being the most likely to consume it. Americans living in the East and those with high incomes are the most likely to shun soda altogether. Americans in general prefer regular soda to diet -- 32% vs. 24%. But, the plurality (43%) say they don't drink soda at all.
These data, from Gallup's annual Consumption Habits survey, confirm the broad soda consumption finding in a July 2012 poll, in which about half of Americans reported drinking at least one glass of soda per day.
Researchers have long studied the link between regular soda consumption and obesity, and more recently are exploring the connection between diet soda and weight gain -- although there is no clear consensus yet on that front. It appears that increased awareness of the weight-gain issues associated with soda may be contributing to declining sales. Coke in particular just launched an ad campaign promoting its diet soda products, defending its use of the sugar-free sweetener aspartame.
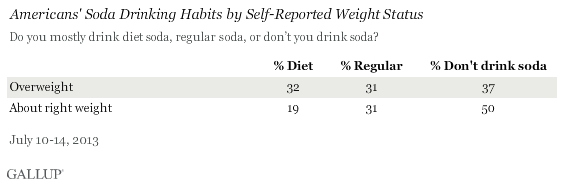
Overweight Americans More Likely to Drink Soda in General
Americans who say they are overweight are more likely to drink soda in general than are those who describe themselves as being "about right" in their weight. However, 31% of the overweight and those who say they are about right say they drink regular soda most often. Thus the difference in soda consumption between these groups comes in the percentage drinking mostly diet soda -- 32% of overweight Americans say they drink it compared with 19% of those whose weight is about right.
Bottom Line
More than half of Americans drink soda -- and regular soda edges out diet among those who consume these beverages. Regular soda contains a lot of calories and sugar, which can have negative health implications. Increased awareness of this among government officials and consumers is apparent in efforts to remove soda machines from school lunchrooms, to limit the size of beverages that restaurants can serve, and in the decreasing market share for soda compared with bottled water and other beverages.
That more than three in 10 Americans drink regular soda likely isn't helping with the nation's obesity epidemic. But, it appears that regular soda is not the only problem when it comes to weight gain. Overweight Americans are just as likely as those of a healthy weight to drink regular soda -- it is diet soda that the overweight are much more likely to drink. It is possible that overweight Americans have become more aware of regular soda's high caloric level and could have disproportionately shifted to diet soda, making the exact relationship between consuming soda -- regular or diet -- and being overweight hard to decipher.
Survey Methods
Results for this Gallup poll are based on telephone interviews conducted July 10-14, 2013, with a random sample of 2,027 adults, aged 18 and older, living in all 50 U.S. states and the District of Columbia.
For results based on the total sample of national adults, one can say with 95% confidence that the margin of sampling error is ±4 percentage points.
For results based on the total sample of 921 adults who describe themselves as overweight, one can say with 95% confidence that the margin of sampling error is ±4 percentage points.
Interviews are conducted with respondents on landline telephones and cellular phones, with interviews conducted in Spanish for respondents who are primarily Spanish-speaking. Each sample of national adults includes a minimum quota of 50% cellphone respondents and 50% landline respondents, with additional minimum quotas by region. Landline telephone numbers are chosen at random among listed telephone numbers. Cellphones numbers are selected using random digit dial methods. Landline respondents are chosen at random within each household on the basis of which member had the most recent birthday.
Samples are weighted to correct for unequal selection probability, nonresponse, and double coverage of landline and cell users in the two sampling frames. They are also weighted to match the national demographics of gender, age, race, Hispanic ethnicity, education, region, population density, and phone status (cellphone only/landline only/both, cellphone mostly, and having an unlisted landline number). Demographic weighting targets are based on the March 2012 Current Population Survey figures for the aged 18 and older U.S. population. Phone status targets are based on the July-December 2011 National Health Interview Survey. Population density targets are based on the 2010 census. All reported margins of sampling error include the computed design effects for weighting.
In addition to sampling error, question wording and practical difficulties in conducting surveys can introduce error or bias into the findings of public opinion polls.
View methodology, full question results, and trend data.
For more details on Gallup's polling methodology, visit www.gallup.com.
