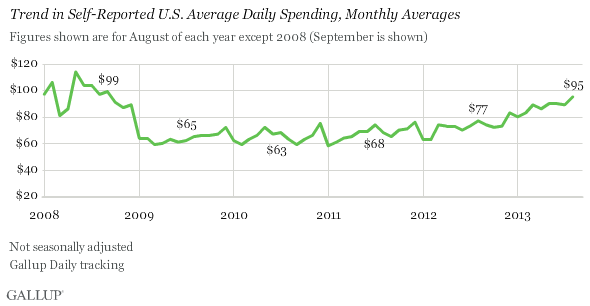
PRINCETON, NJ -- Americans' self-reported daily spending averaged $95 in August, up from $89 in July. The latest spending estimate is the highest Gallup has measured in any month since a $99 reading in September 2008.
Gallup asks Americans on its Daily tracking survey to report how much they spent the prior day, excluding household bills and major purchases like a car or home. The data give an estimate of discretionary spending.
Gallup's spending measure has generally been trending upward since late 2012. From 2009 until November 2012, the monthly averages were consistently below $80. That "new normal" period in spending, tied to the sluggish economy and high unemployment rate, represented a dramatic change from 2008, the first year Gallup asked the question. In 2008, each monthly estimate exceeded $80, including four months with averages above $100.
Spending this August was more robust in the first part of the month than in the later part. From Aug. 1-13, Gallup's spending estimate averaged $103, but from Aug. 14-31 the average was $89. The late August figures were still relatively healthy because they exceed the spending average of $88 for 2013 to date.
August's stronger numbers come after a three-month period in which Gallup's spending measure was generally flat.
August Spending Strong Among Upper-Income, Parents
Groups that typically report higher spending levels -- upper-income Americans, parents, those aged 30 to 49, and men -- also reported higher levels in August than in July. But most key subgroups showed at least marginally higher spending in August, including middle- and lower-income Americans and those with no children under 18.
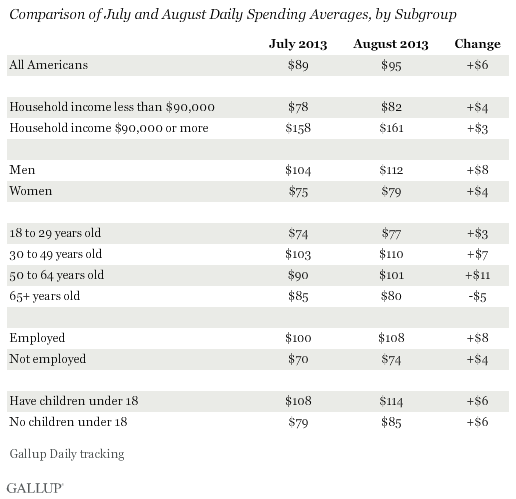
August is a prime season for retailers due to back-to-school shopping, but both parents and non-parents reported higher August spending, suggesting the spending boost was a result of other factors. These could include travel and other summer recreational spending, which could be higher this year, given Americans' greater confidence in the economy now than in prior years.
Implications
Consumer spending has been making a comeback this year, according to Gallup's daily spending estimates, highlighted by August's numbers, which are the strongest in five years. Improved spending is the surest way for the economy to return to health, given how reliant the U.S. economy is on consumer activity.
The August increase in Gallup's spending measure is a positive sign for the economy after Gallup and government spending estimates suggested little spending growth in July. A key to keeping up the positive momentum is whether Americans pull back in September or continue to spend at higher levels.
Gallup.com reports results from these indexes in daily, weekly, and monthly averages and in Gallup.com stories. Complete trend data are always available to view and export in the following charts:
Daily: Employment, Economic Confidence, Job Creation, Consumer Spending
Weekly: Employment, Economic Confidence, Job Creation, Consumer Spending
Read more about Gallup's economic measures.
View our economic release schedule.
Survey Methods
Results for this Gallup poll are based on telephone interviews conducted Aug. 1-31, 2013, on the Gallup Daily tracking survey, with a random sample of 15,802 adults, aged 18 and older, living in all 50 U.S. states and the District of Columbia.
For results based on the total sample of national adults, one can say with 95% confidence that the margin of sampling error is ±1 percentage point.
The margin of error on the mean estimate of spending is ±$5.
Interviews are conducted with respondents on landline telephones and cellular phones, with interviews conducted in Spanish for respondents who are primarily Spanish-speaking. Each sample of national adults includes a minimum quota of 50% cellphone respondents and 50% landline respondents, with additional minimum quotas by region. Landline and cell telephone numbers are selected using random-digit-dial methods. Landline respondents are chosen at random within each household on the basis of which member had the most recent birthday.
Samples are weighted to correct for unequal selection probability, nonresponse, and double coverage of landline and cell users in the two sampling frames. They are also weighted to match the national demographics of gender, age, race, Hispanic ethnicity, education, region, population density, and phone status (cellphone only/landline only/both, and cellphone mostly). Demographic weighting targets are based on the March 2012 Current Population Survey figures for the aged 18 and older U.S. population. Phone status targets are based on the July-December 2011 National Health Interview Survey. Population density targets are based on the 2010 census. All reported margins of sampling error include the computed design effects for weighting.
In addition to sampling error, question wording and practical difficulties in conducting surveys can introduce error or bias into the findings of public opinion polls.
For more details on Gallup's polling methodology, visit www.gallup.com.
