PRINCETON, NJ -- Gallup's U.S. Job Creation Index remained steady in August at +22, with private-sector employees continuing to be most likely to report that their employers are hiring workers rather than letting workers go. Federal government workers still report the most negative hiring situation. State and local government workers' perceptions of hiring and firing at their workplaces in August were between these two extremes. There has been little significant change in this overall rank order over the past year.
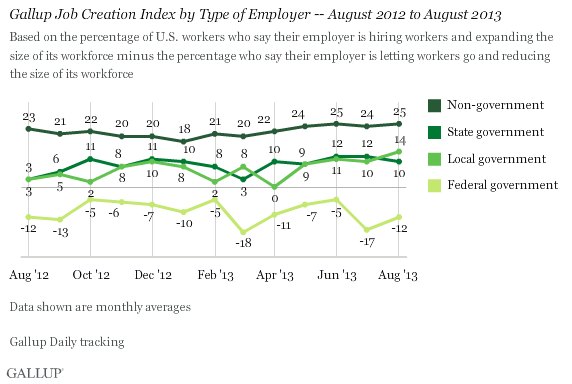
Gallup's Job Creation Index is derived by subtracting the percentage of workers who say their place of employment is letting workers go and reducing the size of its workforce from the percentage who say their employer is hiring and expanding the size of its workforce.
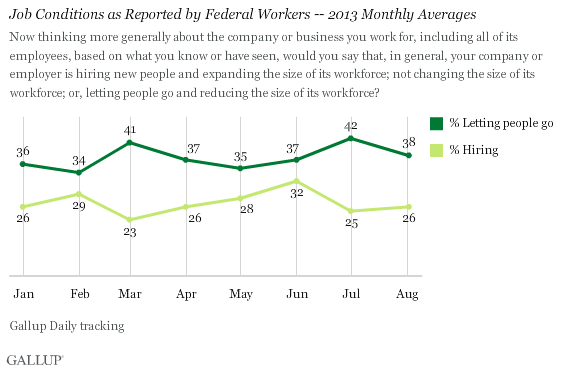
Federal government workers have been more negative than positive about hiring at their workplaces all year, with some monthly fluctuations. Thirty-eight percent of federal workers in August said their place of employment was letting people go, whereas 26% said their employer was hiring. These numbers are slightly less negative than in July, but on par with previous months in 2013.
That private-sector workers report more hiring at their workplaces than do federal employees is a reversal of the situation in 2008 and 2009. In March 2009, for example, federal government workers reported an overall +30 Job Creation Index score, contrasted with an anemic -5 from private-sector workers, and -14 and -7 from state and local government workers, respectively.
The winding down of spending associated with the wars in Afghanistan and Iraq and the war on terror plus the increased pressure to cut government spending in the political arena in recent years have helped drive these changes. The sequestration cuts in government spending that took effect earlier this year may also be a cause, although the negative hiring reports from federal workers were evident before sequestration occurred.
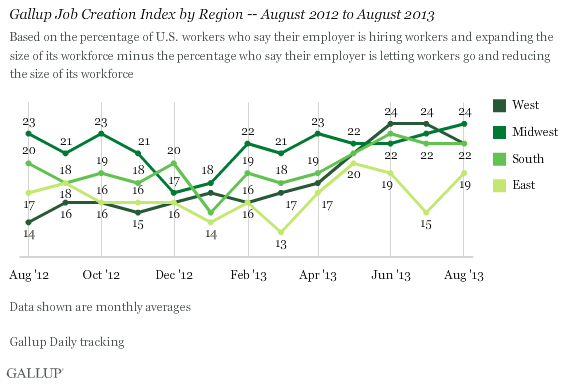
Eastern Workers Slightly More Negative About Job Creation
Job creation was relatively even in August across regions, although workers in the East were slightly less positive about their employers' hiring than those in the other three regions of the country. Eastern workers have maintained this modestly more negative position for the last three months.
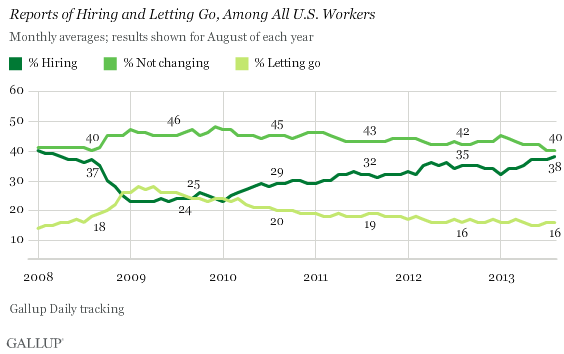
Job Creation Index Yet to Recover to January 2008 Level
Even though Gallup's Job Creation Index has been inching up since the recession, it is not quite back to its peak. Its high of +26 was measured when Gallup instituted the index in January 2008, and, after dropping to its all-time low of -5 in February and April 2009, it has recovered -- although not yet back to where it was in 2008.
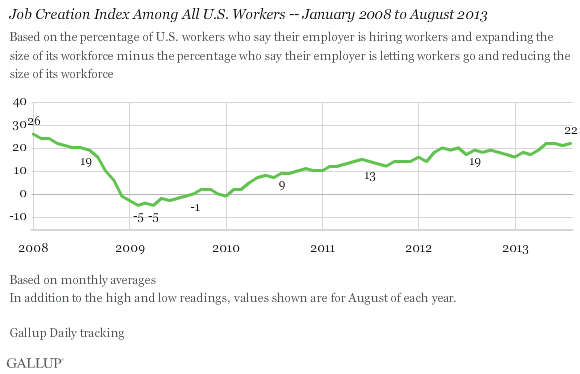
Throughout August, 38% of workers said their companies were hiring, 16% said they were letting people go, and 40% said their companies were staying the same size. The percentage of workers reporting that their employers are hiring is up from the low of 23% recorded in several months in 2009 and in January 2010, while the 16% who say their employer is firing people is down from a high of 28% in 2009.
Bottom Line
U.S. job creation appears to have stabilized over the last several months in a more improved situation than was evident in the aftermath of the financial crisis and recession of 2008 -- although still not back to where it was prior to those economic events. The data make it clear that the federal government continues to shed jobs, while state and local governments are more on the positive side of the job-creation ledger. Workers in the private sector remain most positive about job creation at their places of employment.
Gallup.com reports results from these indexes in daily, weekly, and monthly averages and in Gallup.com stories. Complete trend data are always available to view and export in the following charts:
Daily: Employment, Economic Confidence, Job Creation, Consumer Spending
Weekly: Employment, Economic Confidence, Job Creation, Consumer Spending
Read more about Gallup's economic measures.
View our economic release schedule.
Survey Methods
Results for this Gallup poll are based on telephone interviews conducted Aug. 1-31, 2013, on the Gallup Daily tracking survey, with a random sample of 18,473 adults, aged 18 and older, employed full or part time, living in all 50 U.S. states and the District of Columbia.
For results based on the total sample of employed adults, one can say with 95% confidence that the margin of sampling error is ±1 percentage point.
Interviews are conducted with respondents on landline telephones and cellular phones, with interviews conducted in Spanish for respondents who are primarily Spanish-speaking. Each sample of national adults includes a minimum quota of 50% cellphone respondents and 50% landline respondents, with additional minimum quotas by region. Landline and cell telephone numbers are selected using random-digit-dial methods. Landline respondents are chosen at random within each household on the basis of which member had the most recent birthday.
Samples are weighted to correct for unequal selection probability, nonresponse, and double coverage of landline and cell users in the two sampling frames. They are also weighted to match the national demographics of gender, age, race, Hispanic ethnicity, education, region, population density, and phone status (cellphone only/landline only/both, and cellphone mostly). Demographic weighting targets are based on the March 2012 Current Population Survey figures for the aged 18 and older U.S. population. Phone status targets are based on the July-December 2011 National Health Interview Survey. Population density targets are based on the 2010 census. All reported margins of sampling error include the computed design effects for weighting.
In addition to sampling error, question wording and practical difficulties in conducting surveys can introduce error or bias into the findings of public opinion polls.
For more details on Gallup's polling methodology, visit www.gallup.com.