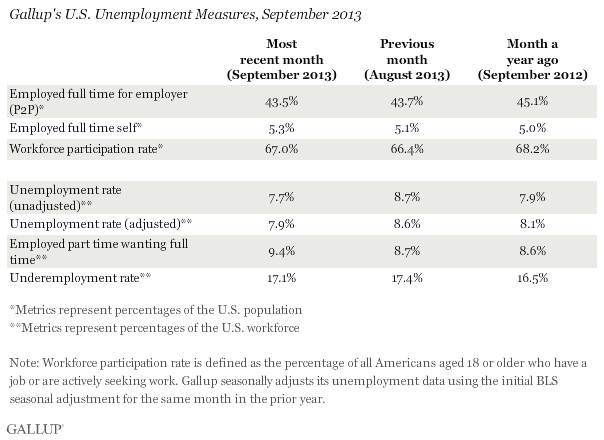
WASHINGTON, D.C. -- The U.S. Payroll to Population employment rate (P2P), as measured by Gallup, fell slightly to 43.5% in September, from 43.7% in August. P2P has declined more than a percentage point from the 45.1% found in September 2012.
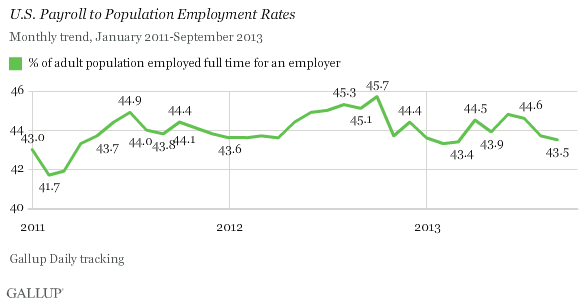
Gallup's P2P metric estimates the percentage of the U.S. adult population aged 18 and older who are employed full time by an employer for at least 30 hours per week. P2P is not seasonally adjusted.
These results are based on Gallup Daily tracking interviews with approximately 30,000 Americans, conducted Sept. 1-30 by landline and cellphone. Gallup does not count adults who are self-employed, working part time, unemployed, or out of the workforce as payroll-employed in the P2P metric.
Because of seasonal fluctuations, year-over-year comparisons are helpful in evaluating whether monthly changes are due to seasonal hiring patterns or true growth (or deterioration) in the percentage of people working full time for an employer. While the P2P rate for September is down from the same month last year, it is similar to what Gallup found in September 2011 and 2010 -- meaning there has been essentially no growth in full-time employment for an employer since at least 2010, the first year Gallup polled on this measure.
The employment situation improved in the late summer and early fall of 2012, with the P2P rate in August through October increasing by more than one point over the same months in 2011. That momentum slowed in the winter, and the P2P rate has stayed the same or slightly declined for eight out of nine months this year, compared with the same months in 2012.
Although P2P is down, the percentage of Americans working full time for themselves has gone up slightly, but this does not account for all of the year-over-year decline in P2P. Full-time self-employment is at 5.3% in September, up from 5.1% in August and 5.0% in September 2012.
Seasonally Unadjusted Unemployment Drops in September
Unlike Gallup's P2P rate, which is a percentage of the total population, traditional employment metrics, such as the unemployment rates Gallup and the U.S. Bureau of Labor Statistics report, are based on the percentage of the workforce. Gallup defines the "workforce" as adults who are working or actively looking for work and available for employment. The U.S. workforce participation rate in September was 67.0%, an increase from August's 66.4%, but down from 68.2% in September 2012.
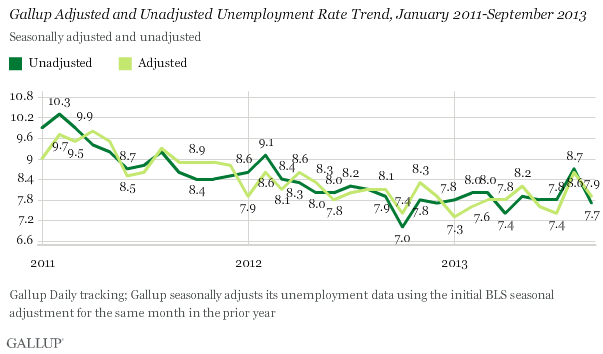
Gallup's unadjusted unemployment rate for the U.S. workforce declined to 7.7% in September, from 8.7% in August, returning to about what it was in July. Similar to P2P, unemployment fluctuates seasonally, and the year-over-year change is the most informative comparison. Last month's unadjusted unemployment rate is down slightly from 7.9% in September 2012.
Gallup's seasonally adjusted U.S. unemployment rate for September is 7.9%, down from 8.6% in August. Gallup calculates this rate by applying the adjustment factor the government used for the same month in the previous year. Last year, the government adjusted September's rate upward by 0.2 points.
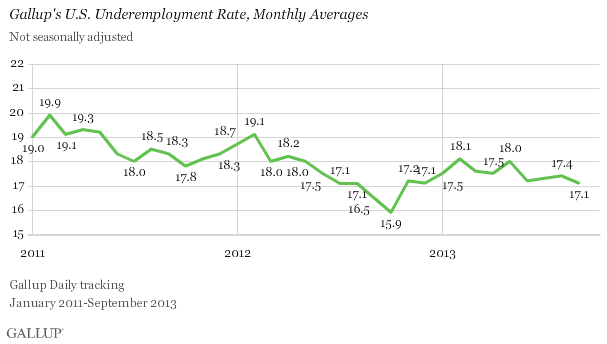
Underemployment, as measured without seasonal adjustment, was 17.1% in September, down slightly from 17.4% in August, but up compared with 16.5% in September 2012. Gallup's U.S. underemployment rate combines the percentage of adults in the workforce who are unemployed with the percentage of those who are working part time but looking for full-time work.
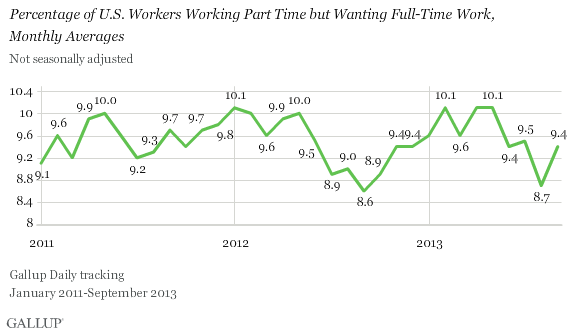
The percentage of part-time workers wanting full-time work was 9.4% in September, up from 8.7% in August and from 8.6% last September. This suggests the decline in the unemployment rate is actually due to more Americans taking part-time jobs rather than gaining the full-time employment they want.
Bottom Line
Gallup's unadjusted and seasonally adjusted unemployment rates experienced month-over-month and year-over-year declines in September. However, Gallup's P2P rate -- the percentage of all adults in the U.S. population who are employed full time -- fell slightly compared with August and is 1.6 points lower than it was in September 2012. This means fewer people are unemployed, but not because they found full-time jobs. The percentage of part-time workers wanting full-time work increased last month from August and from September 2012, suggesting that some of those who were unemployed left the workforce or found part-time work, but not the full-time jobs they are seeking.
Gallup's seasonally adjusted U.S. unemployment rate -- the closest comparison it has to the official numbers released by the BLS -- declined in September, after ticking up in August, and is now more on par with the level seen in July and in earlier months this year. The government shutdown that began Tuesday may prevent the BLS from releasing its September employment report on Friday as scheduled. Gallup data suggest that when the report is released, the BLS will likely report no change in the unemployment rate.
However, it is important to note that Gallup's adjusted number is based on past BLS seasonal adjustments, and those adjustments may not be the same this year. Additionally, while both Gallup and BLS data are based on robust surveys, the two have important methodological differences. Thus, although Gallup's employment numbers are highly correlated with BLS rates, Gallup's numbers tend to have more month-to-month variability, and the unemployment rate as reported by the BLS each month does not always track precisely with the Gallup estimate.
Gallup.com reports results from these indexes in daily, weekly, and monthly averages and in Gallup.com stories. Complete trend data are always available to view and export in the following charts:
Daily: Employment, Economic Confidence, Job Creation, Consumer Spending
Weekly: Employment, Economic Confidence, Job Creation, Consumer Spending
Read more about Gallup's economic measures.
View our economic release schedule.
Survey Methods
Results for this Gallup poll are based on telephone interviews conducted Sept. 1-30, 2013, on the Gallup Daily tracking survey, with a random sample of 30,628 adults, aged 18 and older, living in all 50 U.S. states and the District of Columbia.
For results based on the total sample of national adults, one can say with 95% confidence that the margin of sampling error is ±1 percentage point.
Interviews are conducted with respondents on landline telephones and cellular phones, with interviews conducted in Spanish for respondents who are primarily Spanish-speaking. Each sample of national adults includes a minimum quota of 50% cellphone respondents and 50% landline respondents, with additional minimum quotas by region. Landline and cell telephone numbers are selected using random-digit-dial methods. Landline respondents are chosen at random within each household on the basis of which member had the most recent birthday.
Samples are weighted to correct for unequal selection probability, nonresponse, and double coverage of landline and cell users in the two sampling frames. They are also weighted to match the national demographics of gender, age, race, Hispanic ethnicity, education, region, population density, and phone status (cellphone only/landline only/both, and cellphone mostly). Demographic weighting targets are based on the March 2012 Current Population Survey figures for the aged 18 and older U.S. population. Phone status targets are based on the July-December 2011 National Health Interview Survey. Population density targets are based on the 2010 census. All reported margins of sampling error include the computed design effects for weighting.
In addition to sampling error, question wording and practical difficulties in conducting surveys can introduce error or bias into the findings of public opinion polls.
For more details on Gallup's polling methodology, visit www.gallup.com.
