WASHINGTON, D.C. -- Americans' confidence in the economy has deteriorated more in the past week during the partial government shutdown than in any week since Lehman Brothers collapsed on Sept. 15, 2008, which triggered a global economic crisis. Gallup's Economic Confidence Index tumbled 12 points to -34 last week, the second-largest weekly decline since Gallup began tracking economic confidence daily in January 2008.
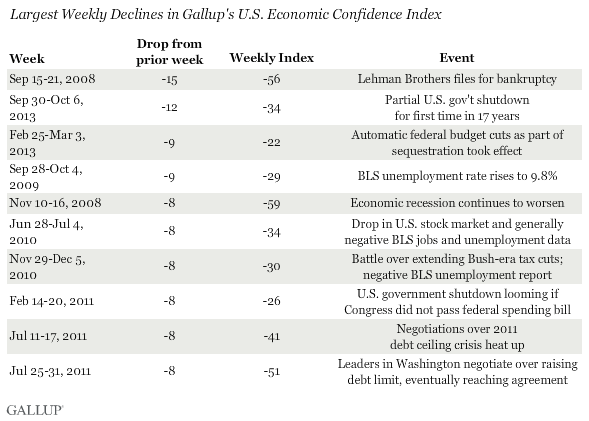
Fiscal brinksmanship in Washington is related to many of the largest weekly drops in Americans' confidence in the economy since 2008. Gallup's Economic Confidence Index fell nine points in late February and early March 2013 as Congress and President Barack Obama failed to reach an agreement to avoid automatic federal spending cuts as part of sequestration. Economic confidence fell eight points during the week ending Feb. 20, 2011, as Congress and the president reached an agreement on the federal budget at the last minute, avoiding a government shutdown.
Americans' confidence in the economy fell eight points during two separate weeks in July 2011, as leaders in Washington debated over whether to raise the debt limit or default on the nation's debts. Standard & Poor's subsequent downgrading of the U.S. credit rating and falling U.S. stock market prices also negatively affected Americans' confidence in the economy. Similarly, economic confidence could continue to fall in the coming days and weeks as Congress and the president work to reach an agreement to raise the debt ceiling by the upcoming Oct. 17 deadline.
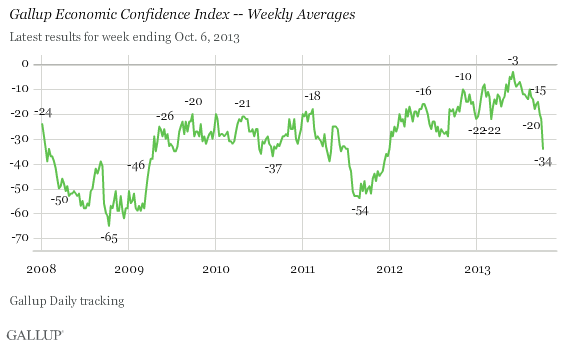
Still, economic confidence bounced back within several months of the 2011 debt crisis and the downgrading of the U.S. credit rating. Likewise, confidence rebounded within weeks of the sequestration spending cuts that took effect in early March 2013. This suggests that these fiscal debates may not affect consumer confidence in the same long-term negative way that hits to the economy -- like the 2008-2009 economic recession -- do.
Gallup's Economic Confidence Index has plunged 19 points since the middle of September and is now, at -34, at its lowest level since late December 2011. Confidence is significantly worse than it was in late May and early June of this year, when it peaked at -3.
Gallup's Economic Confidence Index is based on two components: Americans' assessments of current economic conditions in the United States and their perceptions of whether the economy is getting better or worse. Since mid-September, the outlook component of the index has fallen twice as much as the current conditions component.
Currently, 67% of Americans say the economy is getting worse, the highest such percentage since early December 2011, while 28% now say it is getting better. This results in a net economic outlook score of -39, down 17 points from the prior week.
Last week, 15% of Americans said the economy is in excellent or good shape, and 43% said it is poor. This results in a net current conditions score of -28, down seven points from the prior week.
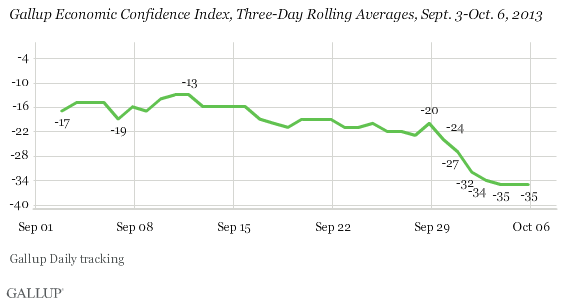
While Gallup's three-day rolling averages sank 14 points to -34 for Oct. 1-3 as the shutdown began, they have since stabilized at -35 through Oct. 6. This may be a positive sign that the partial government shutdown itself will not drive Americans' confidence much lower -- something the intensifying debate over the debt limit and the possibility of default could do.
Bottom Line
Gallup's Economic Confidence Index seemed poised to enter positive territory in late May and early June, but never did and has grown more negative since. The government shutdown dealt Americans' confidence a big blow, resulting in a one-week 12-point drop in the index -- the second-largest weekly drop since Gallup began Daily tracking in January 2008, and the largest decline since the week Lehman Brothers collapsed.
While the economy is, in many respects, stronger than it was during the 2011 debt ceiling crisis, the current budget debate and government shutdown clearly show that partisan brinksmanship and the uncertainty it causes on Wall Street can negatively affect consumer confidence. Thus, Congress' inability to reach a compromise to end the government shutdown and raise the debt ceiling could negatively affect U.S. stock prices, America's credit rating, and, ultimately, the nation's economic recovery.
Gallup.com reports results from these indexes in daily, weekly, and monthly averages and in Gallup.com stories. Complete trend data are always available to view and export in the following charts:
Daily: Employment, Economic Confidence, Job Creation, Consumer Spending
Weekly: Employment, Economic Confidence, Job Creation, Consumer Spending
Read more about Gallup's economic measures.
View our economic release schedule.
Survey Methods
Results for this Gallup poll are based on telephone interviews conducted Sept. 30-Oct. 6, 2013, on the Gallup Daily tracking survey, with a random sample of 3,580 adults, aged 18 and older, living in all 50 U.S. states and the District of Columbia.
For results based on the total sample of national adults, one can say with 95% confidence that the margin of sampling error is ±2 percentage points.
For results from three-day rolling averages based on the total sample of national adults, one can say with 95% confidence that the margin of sampling error is ±3 percentage points.
Interviews are conducted with respondents on landline telephones and cellular phones, with interviews conducted in Spanish for respondents who are primarily Spanish-speaking. Each sample of national adults includes a minimum quota of 50% cellphone respondents and 50% landline respondents, with additional minimum quotas by region. Landline and cell telephone numbers are selected using random-digit-dial methods. Landline respondents are chosen at random within each household on the basis of which member had the most recent birthday.
Samples are weighted to correct for unequal selection probability, nonresponse, and double coverage of landline and cell users in the two sampling frames. They are also weighted to match the national demographics of gender, age, race, Hispanic ethnicity, education, region, population density, and phone status (cellphone only/landline only/both, and cellphone mostly). Demographic weighting targets are based on the March 2012 Current Population Survey figures for the aged 18 and older U.S. population. Phone status targets are based on the July-December 2011 National Health Interview Survey. Population density targets are based on the 2010 census. All reported margins of sampling error include the computed design effects for weighting.
In addition to sampling error, question wording and practical difficulties in conducting surveys can introduce error or bias into the findings of public opinion polls.
For more details on Gallup's polling methodology, visit www.gallup.com.
