PRINCETON, NJ -- As the government shutdown continued for a second week and Washington leaders scrambled to avoid a default on U.S. debt obligations, Americans' confidence in the economy continued to erode last week. Gallup's Economic Confidence Index averaged -39, down five points from the prior week. That followed a 12-point drop during the first week of the government shutdown.
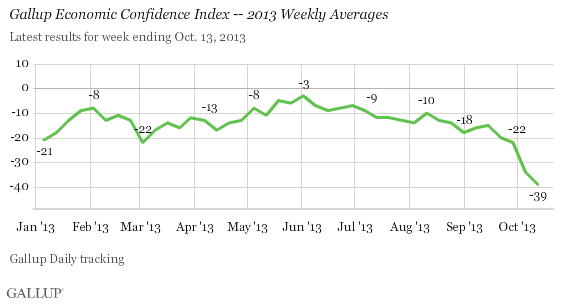
The -39 index score last week is the lowest Gallup has measured since late November/early December 2011. That was part of a long slump in economic confidence that began in July 2011 amid negotiations to raise the federal debt limit. Economic confidence stayed low even after the government reached agreement to raise the limit because Standard & Poor's downgraded the U.S. government's credit rating, and stock prices were volatile in the months that followed. Gallup's confidence index dropped as low as -54 during the week of Aug. 22-28, 2011.
Since Gallup began Daily tracking of economic confidence in 2008, it has been as low as -65 on a weekly basis, reaching that level the week of Oct. 6-12, 2008, after Congress passed and President George W. Bush signed the Troubled Asset Relief Program (TARP) to prevent large financial institutions from failing in response to the financial crisis that fall. The index has stayed in negative territory throughout the daily tracking era, with the high point a -3 score for the week of May 27-June 2, 2013.
Gallup's Economic Confidence Index is based on Americans' assessments of current U.S. economic conditions and their perceptions of whether the economy is getting better or worse. It has a theoretical minimum of -100, if all Americans thought the economy was poor and getting worse, and a theoretical maximum of +100, if all Americans thought the economy was excellent or good and getting better.
Seven in 10 Americans Say Economy Getting Worse
Last week, an average of 71% of Americans said the economy was getting worse, while 25% said it was getting better. The resulting -46 economic outlook score is down 24 points in the last two weeks, and 35 points in the last month.
Americans' assessments of current economic conditions have also grown increasingly negative. Last week, 14% of Americans described current economic conditions as "excellent" or "good," and 46% as "poor." The -32 current conditions score is down 11 points in the last two weeks, and 14 points in the last month.
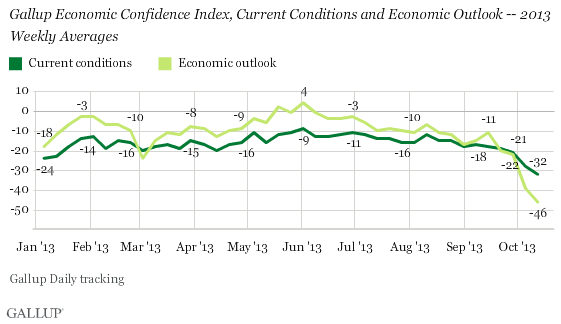
Therefore, of the two components of Gallup's Economic Confidence Index, it is Americans' expectations of the economy's direction that have suffered more in recent weeks. Consequently, Americans are more pessimistic about the direction in which the economy is headed than about its current health, a departure from what has been the case during nearly all of 2013.
Both components of the Economic Confidence Index have not been worse since late 2011.
Implications
As the U.S. government approached a default on its debt obligations, at the same time that the government stopped providing non-essential services, Americans' economic confidence continued to get worse. The dip in confidence began in mid-September as the shutdown loomed, and accelerated after the shutdown began.
The previous Washington struggle over the debt limit helped spur a protracted slump in Americans' economic confidence, which lasted nearly five months. That slump took place at a time when the government was still operating, but also as the unemployment rate was significantly higher than it is now and the stock market was not nearly as strong.
Thus, one key to whether economic confidence continues to decline to the -50 range last seen in 2011, or begins to recover, is how the financial markets react to any agreements the government makes to end the government shutdown and increase the federal debt limit.
Gallup.com reports results from these indexes in daily, weekly, and monthly averages and in Gallup.com stories. Complete trend data are always available to view and export in the following charts:
Daily: Employment, Economic Confidence, Job Creation, Consumer Spending
Weekly: Employment, Economic Confidence, Job Creation, Consumer Spending
Read more about Gallup's economic measures.
View our economic release schedule.
Survey Methods
Results for this Gallup poll are based on telephone interviews conducted Oct. 7-13, 2013, on the Gallup Daily tracking survey, with a random sample of 3,571 adults, aged 18 and older, living in all 50 U.S. states and the District of Columbia.
For results based on the total sample of national adults, one can say with 95% confidence that the margin of sampling error is ±2 percentage points.
Interviews are conducted with respondents on landline telephones and cellular phones, with interviews conducted in Spanish for respondents who are primarily Spanish-speaking. Each sample of national adults includes a minimum quota of 50% cellphone respondents and 50% landline respondents, with additional minimum quotas by region. Landline and cell telephone numbers are selected using random-digit-dial methods. Landline respondents are chosen at random within each household on the basis of which member had the most recent birthday.
Samples are weighted to correct for unequal selection probability, nonresponse, and double coverage of landline and cell users in the two sampling frames. They are also weighted to match the national demographics of gender, age, race, Hispanic ethnicity, education, region, population density, and phone status (cellphone only/landline only/both, and cellphone mostly). Demographic weighting targets are based on the March 2012 Current Population Survey figures for the aged 18 and older U.S. population. Phone status targets are based on the July-December 2011 National Health Interview Survey. Population density targets are based on the 2010 census. All reported margins of sampling error include the computed design effects for weighting.
In addition to sampling error, question wording and practical difficulties in conducting surveys can introduce error or bias into the findings of public opinion polls.
For more details on Gallup's polling methodology, visit www.gallup.com.
