WASHINGTON, D.C. -- The adult obesity rate so far in 2013 is 27.2%, up from 26.2% in 2012, and is on pace to surpass all annual average obesity rates since Gallup-Healthways began tracking in 2008.
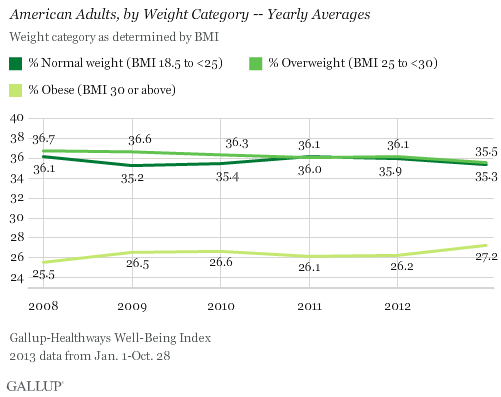
The one-percentage-point uptick in the obesity rate so far in 2013 is statistically significant and is the largest year-over-year increase since 2009. The higher rate thus far in 2013 reverses the lower levels recorded in 2011 and 2012, and is much higher than the 25.5% who were obese in 2008.
The increase in obesity rate is accompanied by a slight decline in the percentage of Americans classified as normal weight or as overweight but not obese. The percentage of normal weight adults fell to 35.3% from 35.9% in 2012, while the percentage of adults who are overweight declined to 35.5% from 36.1% in 2012. An additional 1.9% of Americans are classified as underweight in 2013 so far.
Since 2011, U.S. adults have been about as likely to be classified as overweight as normal weight. Prior to that, Americans were most commonly classified as overweight.
Gallup and Healthways began tracking Americans' weight in 2008. The 2013 data are based on more than 141,000 interviews conducted from Jan. 1 through Oct. 28 as part of the Gallup-Healthways Well-Being Index. Gallup uses respondents' self-reported height and weight to calculate body mass index (BMI) scores. Individual BMI values of 30 or above are classified as "obese," 25 to 29.9 are "overweight," 18.5 to 24.9 are "normal weight," and 18.4 or less are "underweight."
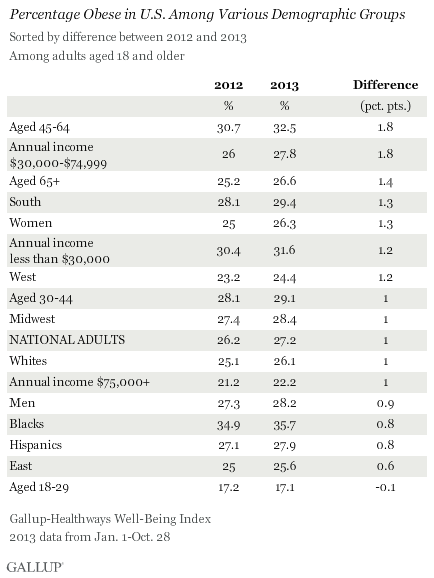
Obesity Rates Increase Across Almost All Demographic Groups
Obesity rates have increased at least slightly so far in 2013 across almost all major demographic and socioeconomic groups. One exception is 18- to 29-year-olds, among whom the percentage who are obese has remained stable. The largest upticks between 2012 and 2013 were among those aged 45 to 64 and those who earn between $30,000 and $74,999 annually. The obesity rate within both groups increased by 1.8 points, which exceeds the one-point increase in the national average.
At 35.7%, blacks continue to be the demographic group most likely to be obese, while those aged 18 to 29 and those who earn over $75,000 annually continue to be the least likely to be obese.
Bottom Line
The U.S. obesity rate thus far in 2013 is trending upward and will likely surpass all annual obesity levels since 2008, when Gallup and Healthways began tracking. It is unclear why the obesity rate is up this year, and the trend since 2008 shows a pattern of some fluctuation. This underscores the possibility that that the recent uptick is shorter-term, rather than a more permanent change. Still, if the current trend continues for the next several years, the implications for the health of Americans and the increased burden on the healthcare system could be significant.
Blacks, those who are middle-aged, and lower-income adults continue to be the groups with the highest obesity rates. The healthcare law could help reduce obesity among low-income Americans if the uninsured sign up for coverage and take advantage of the free obesity screening and counseling that most insurance companies are required to provide under the law.
Employers can also take an active role to help lower obesity rates. Gallup has found that the annual cost for lost productivity due to workers being above normal weight or having a history of chronic conditions ranges from $160 million among agricultural workers to $24.2 billion among professionals. Thus, employers can cut healthcare costs by developing and implementing strategies to help workers maintain or reach a healthy weight.
Gallup has also found that employees who are engaged in their work eat healthier and exercise more. Therefore, employers who actively focus on improving engagement may see healthier and more productive workers, in addition to lower healthcare costs.
About the Gallup-Healthways Well-Being Index
The Gallup-Healthways Well-Being Index tracks well-being in the U.S. and provides best-in-class solutions for a healthier world. To learn more, please visit well-beingindex.com.
Survey Methods
Results are based on telephone interviews conducted as part of the Gallup-Healthways Well-Being Index survey Jan. 1-Oct. 28, 2013, with a random sample of 141,935 adults, aged 18 and older, living in all 50 U.S. states and the District of Columbia.
For results based on the total sample of national adults, one can say with 95% confidence that the margin of sampling error is ±0.5 percentage points.
Interviews are conducted with respondents on landline telephones and cellular phones, with interviews conducted in Spanish for respondents who are primarily Spanish-speaking. Each sample of national adults includes a minimum quota of 50% cellphone respondents and 50% landline respondents, with additional minimum quotas by region. Landline and cellphone numbers are selected using random-digit-dial methods. Landline respondents are chosen at random within each household on the basis of which member had the most recent birthday.
Samples are weighted to correct for unequal selection probability, nonresponse, and double coverage of landline and cell users in the two sampling frames. They are also weighted to match the national demographics of gender, age, race, Hispanic ethnicity, education, region, population density, and phone status (cellphone only/landline only/both, and cellphone mostly). Demographic weighting targets are based on the March 2012 Current Population Survey figures for the aged 18 and older U.S. population. Phone status targets are based on the July-December 2011 National Health Interview Survey. Population density targets are based on the 2010 census. All reported margins of sampling error include the computed design effects for weighting.
In addition to sampling error, question wording and practical difficulties in conducting surveys can introduce error or bias into the findings of public opinion polls.
For more details on Gallup's polling methodology, visit www.gallup.com.