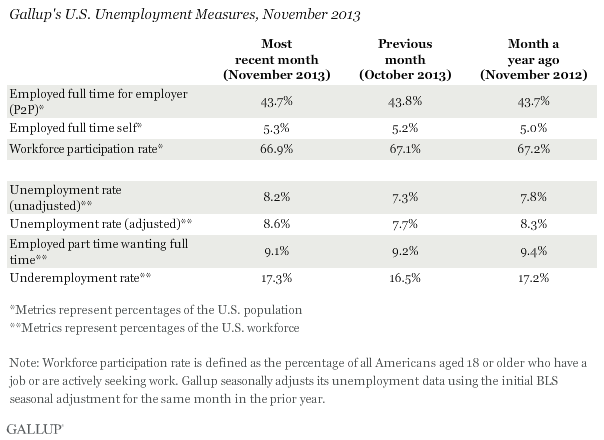
WASHINGTON, D.C. -- The U.S. Payroll to Population employment rate (P2P), as measured by Gallup, was steady at 43.7% in November. This rate is the same as it was in November 2012.
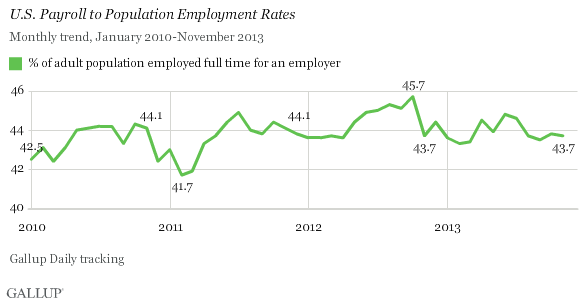
Gallup's P2P metric estimates the percentage of the U.S. adult population aged 18 and older that is employed full time by an employer for at least 30 hours per week. P2P is not seasonally adjusted. However, because of seasonal fluctuations, year-over-year comparisons are often helpful in evaluating whether monthly changes are attributable to seasonal hiring patterns or true growth (or deterioration) in the percentage of people working full time for an employer. P2P for November 2013 is identical to P2P measured in the same month last year (43.7%), but is 0.4 percentage points lower than the 44.1% P2P from November 2010 and 2011.
These results are based on Gallup Daily tracking interviews with almost 30,000 Americans, conducted Nov. 1-30 by landline and cellphone. Gallup does not count adults who are self-employed, working part time, unemployed, or out of the workforce as payroll-employed in the P2P metric.
Seasonally Unadjusted Unemployment 8.2% in November
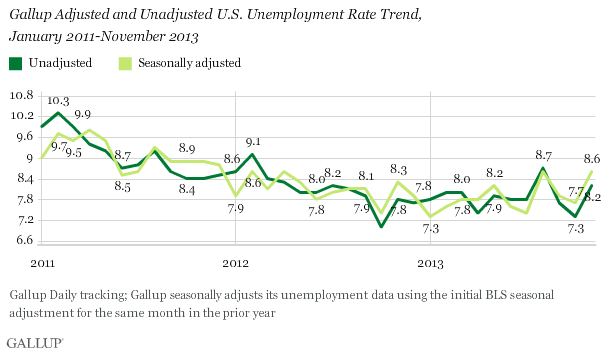
Gallup's unadjusted unemployment rate for the U.S. workforce was 8.2% in November, up from 7.3% in October. Unemployment fluctuates seasonally, as P2P does, and year-over-year change is often the most informative comparison. Unemployment was lower in November 2012 (7.8%) but also rose nearly a full point from 7.0% in October of that year.
Gallup's seasonally adjusted U.S. unemployment rate for November is 8.6%, up from 7.7% in October. The rate is also higher than the 8.3% for November of last year. Gallup calculates this rate by applying the adjustment factor the government used for the same month in the previous year. Last year, the government adjusted November's rate upward by 0.4 points.
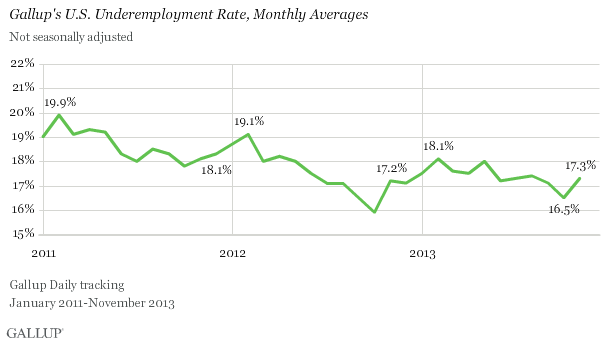
Underemployment, as measured without seasonal adjustment, was 17.3% in November, up from 16.5% in October but statistically unchanged from 17.2% in November 2012. Gallup's U.S. underemployment rate is the percentage of adults in the workforce who are unemployed or working part time but looking for full-time work.
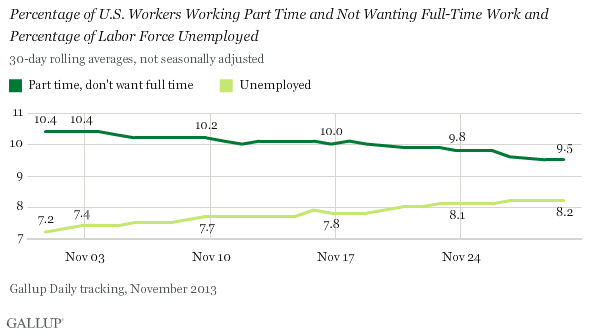
The percentage of part-time workers wanting full-time work was 9.1% in November, statistically unchanged from 9.2% in October. However, the percentage of part-time workers who do not want full-time work was 9.5% in November, down from 10.4% in October. This decrease in part-time workers almost exactly matched the increase in unemployment, suggesting that jobs lost in November may have been from part-time workers who did not want full-time work.
Comparing daily 30-day averages for unemployment and part-timers not wanting full-time work through the month of November 2013 shows that changes in the two rates mirrored each other and were relatively consistent throughout the month. As part-time employment steadily declined over the course of the month, unemployment rose at a similar rate.
Bottom Line
The overall U.S. jobs market was stagnant in November, neither growing nor shrinking the pool of stable, full-time employment. Gallup's P2P rate and the rate of full-time self-employment, which is not included in P2P, were statistically unchanged from October.
Gallup's seasonally adjusted U.S. unemployment rate -- the closest comparison it has to the official numbers released by the Bureau of Labor Statistics -- rose in November, propelled by losses in part-time employment. Gallup data suggest that when BLS releases its November employment report on Friday, it will likely report a similar increase in the U.S. unemployment rate.
However, it is important to note that Gallup's adjusted number is based on past BLS seasonal adjustments, and those adjustments may not be the same this year. Additionally, while both Gallup and BLS data are based on robust surveys, the two have important methodological differences. Although Gallup's employment numbers are highly correlated with BLS rates, Gallup's numbers tend to have more month-to-month variability, and the unemployment rate that BLS reports each month does not always track precisely with Gallup's estimate.
Gallup.com reports results from these indexes in daily, weekly, and monthly averages and in Gallup.com stories. Complete trend data are always available to view and export in the following charts:
Daily: Employment, Economic Confidence, Job Creation, Consumer Spending
Weekly: Employment, Economic Confidence, Job Creation, Consumer Spending
Read more about Gallup's economic measures.
View our economic release schedule.
EDITOR'S NOTE: The phrase "part-timers not wanting full-time work" in the paragraph before the Bottom Line reflects a correction from previous postings of this article.
Survey Methods
Results for this Gallup poll are based on telephone interviews conducted Nov. 1-30, 2013, on the Gallup Daily tracking survey, with a random sample of 28,637 adults, aged 18 and older, living in all 50 U.S. states and the District of Columbia.
For results based on the total sample of national adults, the margin of sampling error is ±1 percentage point at the 95% confidence level.
Interviews are conducted with respondents on landline telephones and cellular phones, with interviews conducted in Spanish for respondents who are primarily Spanish-speaking. Each sample of national adults includes a minimum quota of 50% cellphone respondents and 50% landline respondents, with additional minimum quotas by region. Landline and cell telephone numbers are selected using random-digit-dial methods. Landline respondents are chosen at random within each household on the basis of which member had the most recent birthday.
Samples are weighted to correct for unequal selection probability, nonresponse, and double coverage of landline and cell users in the two sampling frames. They are also weighted to match the national demographics of gender, age, race, Hispanic ethnicity, education, region, population density, and phone status (cellphone only/landline only/both, and cellphone mostly). Demographic weighting targets are based on the March 2012 Current Population Survey figures for the aged 18 and older U.S. population. Phone status targets are based on the July-December 2011 National Health Interview Survey. Population density targets are based on the 2010 census. All reported margins of sampling error include the computed design effects for weighting.
In addition to sampling error, question wording and practical difficulties in conducting surveys can introduce error or bias into the findings of public opinion polls.
For more details on Gallup's polling methodology, visit www.gallup.com.
