PRINCETON, NJ -- Americans' job approval ratings for Congress in 2013 averaged 14%, the lowest annual average in Gallup's history. Congressional approval has averaged 33% since Gallup began measuring it in 1974, with the highest yearly average of 56% reached in 2001.
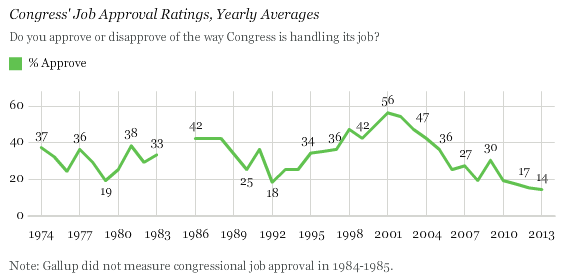
Congress approval has averaged below 20% in each of the last four years, and in five of the last six. Before this time, only in 1979 and 1992 did congressional approval average less than 20% annually. Thus, 2013 extends an unprecedented period in which Americans have given their elected representatives in Congress continually poor marks for their job performance.
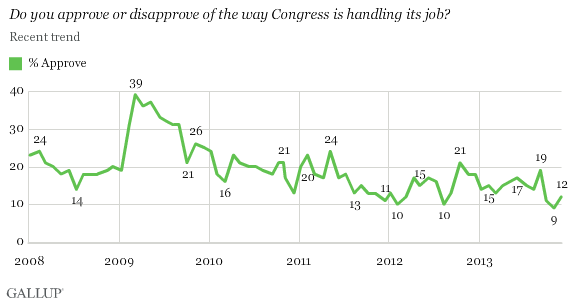
Congress' average approval this year has not only been the worst in Gallup history, but it also included the single lowest monthly approval rating of 9% in November.
Congress approval edged back up slightly to a still-dismal 12% in December. The "high" point for the year was 19% in September. Thus, 2013 is the only year in Gallup's history in which all monthly readings were below 20%, with the exceptions of 1979 and 1992, when Gallup took only one measure of congressional job approval each year.
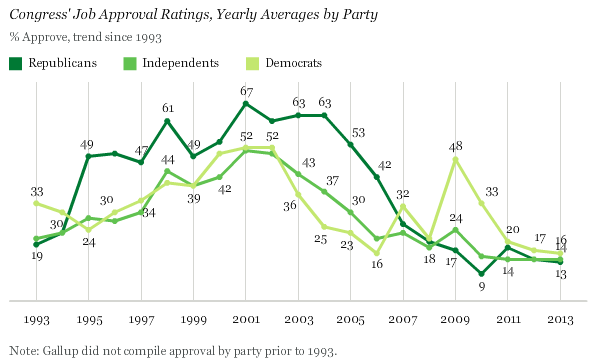
Both Democrats and Republicans continue to rate Congress poorly, as they generally have in recent months. The spread in December between the 14% approval among Democrats and the 10% approval among Republicans is minimal, with independents at 11%. Approval is up slightly among all three groups since last month.
Partisan groups' general consistency in their ratings of Congress is likely a function of the currently divided Congress, with Republicans controlling the House, and Democrats, the Senate. In 2009 and 2010, two years when the Democrats controlled both houses, Democrats routinely gave Congress much higher job ratings than Republicans did. Similarly, between 1995 and 2006, a period characterized by Republican control of both houses, Republicans were consistently more positive than Democrats about Congress.
Implications
Americans' low evaluations of Congress appear to be a "new normal," with average ratings below 20% in each of the last four years, including an average approval of 14% in 2013 -- the lowest in Gallup's 39-year history of this measure.
The Founders set up Congress to be an extension of the American public itself, with elected representatives sent to the nation's capital to do the people's bidding. Americans' approval of the job Congress is doing has never been extremely high on any consistent basis in recent decades, but over the past several years, it has reached new lows. This, to some degree, reflects the currently divided nature of Congress, with the correspondingly reduced stake both party groups have in defending the institution. It also most likely reflects the country's generally negative economic circumstances, and Congress' continuing inability to agree in a timely fashion on fundamental budget and operating legislation, resulting in "fiscal cliffs" and the actual shutdown of government in October of this year.
In the 2014 midterm elections, voters will have an opportunity to elect new representatives, and attitudes may improve if one party or the other obtains control over both houses. But it's possible that negative views of Congress are so prevalent now that more Americans feel that problems are with the institution itself rather than with the particular party or people who control it.
Survey Methods
Results for this Gallup poll are based on telephone interviews conducted Dec. 5-8, 2013, with a random sample of 1,031 adults, aged 18 and older, living in all 50 U.S. states and the District of Columbia.
For results based on the total sample of national adults, the margin of sampling error is ±4 percentage points at the 95% confidence level.
Interviews are conducted with respondents on landline telephones and cellular phones, with interviews conducted in Spanish for respondents who are primarily Spanish-speaking. Each sample of national adults includes a minimum quota of 50% cellphone respondents and 50% landline respondents, with additional minimum quotas by region. Landline and cell telephone numbers are selected using random-digit-dial methods. Landline respondents are chosen at random within each household on the basis of which member had the most recent birthday.
Samples are weighted to correct for unequal selection probability, nonresponse, and double coverage of landline and cell users in the two sampling frames. They are also weighted to match the national demographics of gender, age, race, Hispanic ethnicity, education, region, population density, and phone status (cellphone only/landline only/both, and cellphone mostly). Demographic weighting targets are based on the March 2012 Current Population Survey figures for the aged 18 and older U.S. population. Phone status targets are based on the July-December 2011 National Health Interview Survey. Population density targets are based on the 2010 census. All reported margins of sampling error include the computed design effects for weighting.
In addition to sampling error, question wording and practical difficulties in conducting surveys can introduce error or bias into the findings of public opinion polls.
View methodology, full question results, and trend data.
For more details on Gallup's polling methodology, visit www.gallup.com.