WASHINGTON, D.C. -- Americans' desire to save money rather than spend it may help those vowing to show more financial restraint in the new year. Still, this desire may not translate into more savings in 2014, as those with the least resources in terms of disposable income are actually the most likely to prefer saving money to spending it. This may mean that even as much as the country professes to enjoy saving money, not all are able to do so for financial reasons.
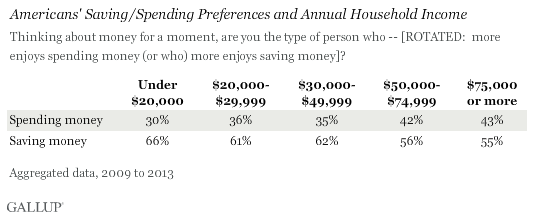
In fact, Americans with the absolute lowest annual household incomes, $20,000 or less, are the most likely to say they enjoy saving money (66%) rather than spending it (30%), compared with Americans at other income levels. The propensity to save drops off notably among those bringing in $50,000 or more, though the majority still lean that way, including 56% of those with household incomes between $50,000 and $74,999 and 55% of those earning $75,000 or more.
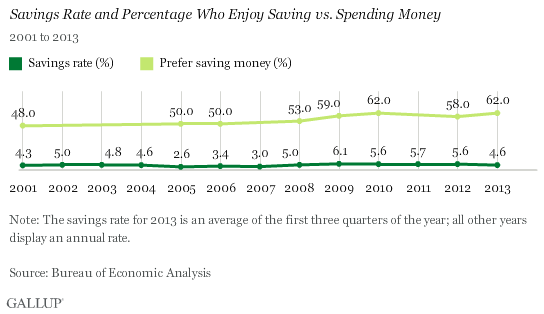
These results come from aggregated Gallup data spanning 2009 to 2013, including interviews with 6,127 U.S. adults. Particularly since the 2008 financial crisis, the majority of Americans have said they prefer saving money to spending it. This stands in contrast to their preferences between 2001 and 2008, when they were more evenly divided between saving and spending money. Even as the economic recovery nears its fifth year, the preference to spend rather than save has not recovered to pre-crisis norms.
According to the U.S. Census Bureau, the median household income in the U.S. was $51,017 in 2012, the last year for which data are available. Notably, individuals reporting this level of income or less are very likely to say they prefer saving their money (63%).
This may be more of a reflection of the discomfort that people with limited funds feel about spending money than an indication that they are disciplined savers. Inclinations aside, many of these individuals may not be able to save because of income restraints. However, this paradox could be one reason the official personal savings rate -- personal savings as a percentage of disposable personal income -- has grown only modestly since 2007, averaging 5.5% per year from 2008 to 2013. By comparison, from 2001 to 2007, the personal savings rate averaged 4.0%.
Saving Preferences Differ by Age and Ideology
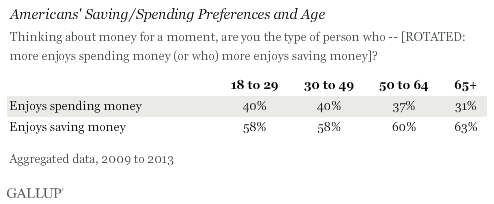
Attitudes about spending versus saving also vary with age. Younger adults are more probable spenders, which makes sense as they are less likely to be supporting a family or paying a mortgage and may figure they have time to save later in life. Older Americans -- those aged 65 and older -- are the most probable savers, with many living on fixed retirement incomes.
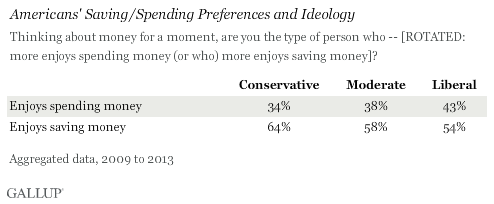
Meanwhile, self-identified conservatives are more likely to say they prefer saving money (64%) than are liberals (54%). This could be a function of age differences, as liberals are more likely to be younger and conservatives more likely to be older, although this dynamic holds across the different age categories. For example, among 18- to 29-year-olds, 66% of conservatives say they enjoy saving more than spending, while 52% of liberals say the same.
Implications
Solid majorities of Americans have preferred saving over spending since 2009. Yet, behind these numbers lie some unfortunate truths. Even with the multitude of Americans expressing preferences to save, the average U.S. household owes $7,128 in credit card debt, while the average stock of student debt that college graduates carry registers at $32,000. U.S. consumers as a whole owe $11.32 trillion, nearly equal to the entire U.S. gross domestic product.
It's not clear how much Americans' relatively new bullish attitudes toward savings will help change these statistics. Serious questions remain about their ability to do so successfully. In other words, saving is determined by more than simply the desire to store away money; one must also have the ability. For a sizable portion of Americans, these two aspects of their financial lives are in serious conflict.
Survey Methods
Results are based on aggregated telephone interviews conducted by Gallup from 2009 to 2013, with a combined sample of 6,127 adults, aged 18 and older, living in all 50 U.S. states and the District of Columbia.
For results based on the total sample of national adults, the margin of sampling error is ±1 percentage point at the 95% confidence level.
Interviews are conducted with respondents on landline telephones and cellular phones, with interviews conducted in Spanish for respondents who are primarily Spanish-speaking. Each sample of national adults includes a minimum quota of 50% cellphone respondents and 50% landline respondents, with additional minimum quotas by region. Landline and cellphone numbers are selected using random-digit-dial methods. Landline respondents are chosen at random within each household on the basis of which member had the most recent birthday.
Samples are weighted to correct for unequal selection probability, nonresponse, and double coverage of landline and cell users in the two sampling frames. They are also weighted to match the national demographics of gender, age, race, Hispanic ethnicity, education, region, population density, and phone status (cellphone only/landline only/both, and cellphone mostly). Demographic weighting targets are based on the March 2012 Current Population Survey figures for the aged 18 and older U.S. population. Phone status targets are based on the July-December 2011 National Health Interview Survey. Population density targets are based on the 2010 census. All reported margins of sampling error include the computed design effects for weighting.
In addition to sampling error, question wording and practical difficulties in conducting surveys can introduce error or bias into the findings of public opinion polls.
For more details on Gallup's polling methodology, visit www.gallup.com.
