PRINCETON, NJ -- Gallup's Job Creation Index again dipped below +20 in December, after several months of meeting or passing that threshold. Still, December's +19 index score matches October's and is an improvement over where the index stood in the first quarter of 2013.
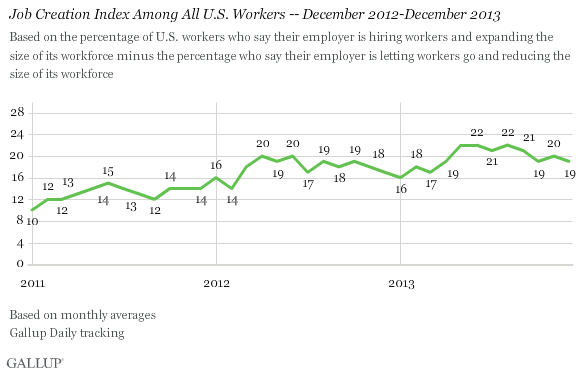
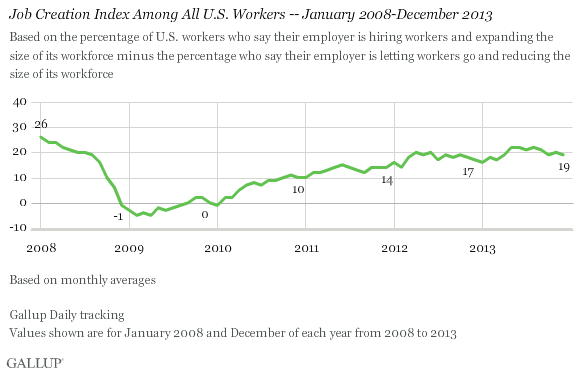
From a broader perspective, the index in December is the best for any December since 2008 -- slightly better than the +17 reading in December 2012 and significantly better than the 2009 through 2011 December scores. The index has yet to return to the six-year high of +26, recorded at the start of the 2008-2009 recession.
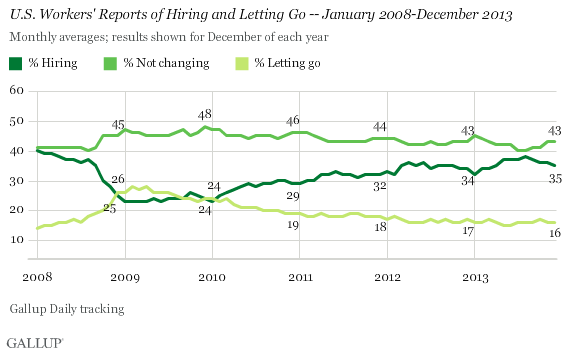
The index is a measure of net hiring in the U.S., based on responses from a nationally representative sample of more than 15,000 full- and part-time workers. Thirty-five percent of all workers in December said their employer was hiring employees and expanding the size of its workforce, while 16% said their employer was letting workers go and reducing the overall size of its workforce, resulting in a +19 net hiring score.
The improvement in the overall index since it bottomed out in December 2008 resulted from incremental increases in the percentage of workers saying their employer is hiring, and corresponding declines in reported layoffs or firing. Meanwhile, the percentage saying the hiring situation in their workplaces is not changing has held fairly steady in the mid-40s.
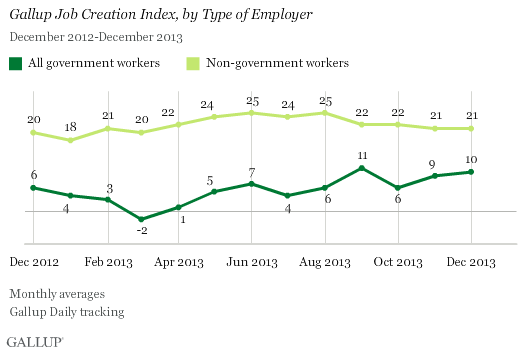
Government Hiring Up in December
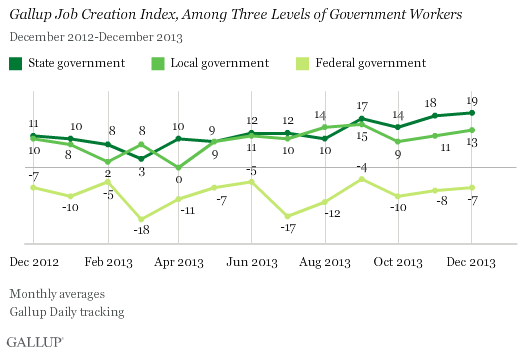
Government employees' reports of net hiring where they work edged higher in the last two months of 2013, reaching +10 in December after dipping to +6 during the federal government shutdown in October and to as low as +4 over the summer. At the same time, the index diminished some this fall among non-government workers, falling to +21 in December from the +25 level reached this spring and summer.
On the other hand, compared with the start of 2013, hiring among non-government workers is little changed, while it is up modestly among government workers.
Most of the gains in net hiring of government workers in 2013 were among state workers, as the December Job Creation Index for this group was up eight points, to +21, over December 2012. Over the same period, the index rose three points among local government workers and was unchanged among federal workers.
Bottom Line
Gallup's Job Creation Index has traced steady improvement in the labor market since the depths of the 2008-2009 recession, and in 2013, it varied in a relatively positive range between +16 and +22. In crossing the +20 barrier earlier this year, the index seemed poised to return to the +26 level Gallup found in January 2008.
However, after reaching +22 over the summer, the index lost momentum and is now hovering at the +20 mark. The index ended the year on a downbeat note, averaging +19 in December. Still, if government employment continues to increase this year as it did in 2013, it will likely result in further growth in the overall index.
Gallup.com reports results from these indexes in daily, weekly, and monthly averages and in Gallup.com stories. Complete trend data are always available to view and export in the following charts:
Daily: Employment, Economic Confidence, Job Creation, Consumer Spending
Weekly: Employment, Economic Confidence, Job Creation, Consumer Spending
Read more about Gallup's economic measures.
View our economic release schedule.
Survey Methods
Results for this Gallup poll are based on telephone interviews conducted Dec. 1-29, 2013, with a random sample of 15,158 adults, aged 18 and older, employed full or part time, living in all 50 U.S. states and the District of Columbia.
For results based on the total sample of employed adults, the margin of sampling error is ±1 percentage points at the 95% confidence level.
Interviews are conducted with respondents on landline telephones and cellular phones, with interviews conducted in Spanish for respondents who are primarily Spanish-speaking. Each sample of national adults includes a minimum quota of 50% cellphone respondents and 50% landline respondents, with additional minimum quotas by region. Landline and cell telephone numbers are selected using random-digit-dial methods. Landline respondents are chosen at random within each household on the basis of which member had the most recent birthday.
Samples are weighted to correct for unequal selection probability, nonresponse, and double coverage of landline and cell users in the two sampling frames. They are also weighted to match the national demographics of gender, age, race, Hispanic ethnicity, education, region, population density, and phone status (cellphone only/landline only/both, and cellphone mostly). Demographic weighting targets are based on the March 2012 Current Population Survey figures for the aged 18 and older U.S. population. Phone status targets are based on the July-December 2011 National Health Interview Survey. Population density targets are based on the 2010 census. All reported margins of sampling error include the computed design effects for weighting.
In addition to sampling error, question wording and practical difficulties in conducting surveys can introduce error or bias into the findings of public opinion polls.
For more details on Gallup's polling methodology, visit www.gallup.com.
