PRINCETON, NJ -- Americans reported spending $96 per day in December -- the highest monthly average since September 2008, when the reality of the depth of the recession and economic crisis began to be felt across the nation. This is also the highest average for any December across the six years that Gallup has been tracking daily spending.
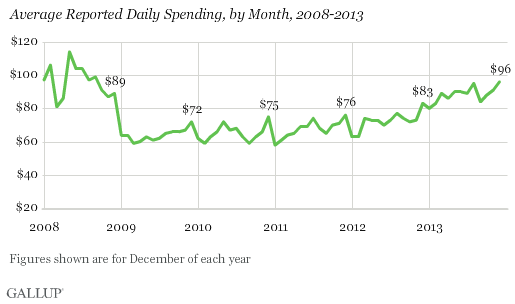
The results are based on Dec. 1-29 Gallup Daily tracking. Each night since January 2008, Gallup has asked Americans to say how much they spent the prior day, aside from normal household bills and major durables such as homes or cars. These data provide an indicator of Americans' discretionary spending. Self-reports of spending, which dropped modestly in the fourth quarter of 2008, dropped dramatically in the first quarter of 2009. But after remaining low for several years, spending began to rise at the end of 2012 and has continued to trend generally upward during 2013, ending the year with an average that was $16 per day higher than Gallup found at the beginning of 2013.
Spending in December is typically the highest of any month because of Christmas holiday spending. The one exception to this came in 2008, with depressed December spending reflecting the effects of the recession. The $96 spending average in December 2013 was up from $91 in November and is the highest of 2013, just above the $95 August average.
Implications
The trend in consumer spending over the past six years presents a clear pattern. Spending was at its highest point in the first three quarters of 2008 -- the year in which Gallup started tracking daily spending -- including the monthly high to date of $114 measured in May. Then came the economic collapse. Spending dropped to its nadir of $58 by January 2011. Since then, it has gradually increased, and spending last year clearly was the most robust since 2008.
Consumer spending is one of the main engines of economic growth, and its trajectory in the months ahead will be an important indicator of the economy's health. If the current trends continue, average daily spending could break through the $100 mark on a routine basis, and thus denote a return to levels that characterized spending in pre-recession times.
Still, continued spending growth is not a certainty. Other attitudinal data show that Americans are still more likely to say they prefer to save rather than spend, and many continue to claim that spending less is the "new normal" in their lives. Additionally, Gallup's measure of job creation slipped slightly at the end of the year, suggesting some caution in concluding that the economy is on a straight linear upward trajectory.
Gallup.com reports results from these indexes in daily, weekly, and monthly averages and in Gallup.com stories. Complete trend data are always available to view and export in the following charts:
Daily: Employment, Economic Confidence, Job Creation, Consumer Spending
Weekly: Employment, Economic Confidence, Job Creation, Consumer Spending
Read more about Gallup's economic measures.
View our economic release schedule.
Survey Methods
Results for this Gallup poll are based on telephone interviews conducted Dec. 1-29, 2013, on the Gallup Daily tracking survey, with a random sample of 13,193 adults, aged 18 and older, living in all 50 U.S. states and the District of Columbia.
For results based on the total sample of national adults, the margin of sampling error is ±1 percentage point at the 95% confidence level.
The margin of error for the spending mean is ±$4.
Interviews are conducted with respondents on landline telephones and cellular phones, with interviews conducted in Spanish for respondents who are primarily Spanish-speaking. Each sample of national adults includes a minimum quota of 50% cellphone respondents and 50% landline respondents, with additional minimum quotas by region. Landline and cell telephone numbers are selected using random-digit-dial methods. Landline respondents are chosen at random within each household on the basis of which member had the most recent birthday.
Samples are weighted to correct for unequal selection probability, nonresponse, and double coverage of landline and cell users in the two sampling frames. They are also weighted to match the national demographics of gender, age, race, Hispanic ethnicity, education, region, population density, and phone status (cellphone only/landline only/both, and cellphone mostly). Demographic weighting targets are based on the March 2012 Current Population Survey figures for the aged 18 and older U.S. population. Phone status targets are based on the July-December 2011 National Health Interview Survey. Population density targets are based on the 2010 census. All reported margins of sampling error include the computed design effects for weighting.
In addition to sampling error, question wording and practical difficulties in conducting surveys can introduce error or bias into the findings of public opinion polls.
For more details on Gallup's polling methodology, visit www.gallup.com.
