WASHINGTON, D.C. -- Gallup's Economic Confidence Index improved to -19 in December from -25 in November, and is now much higher than the -35 found in October amid the federal government shutdown. While the December index matches September's score, it remains below the improved monthly readings that prevailed from October 2012 through August 2013.
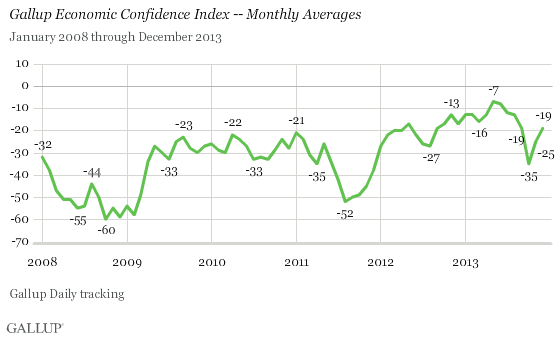
Although Americans are still more negative than positive about the economy overall, the index is toward the higher end of the full range seen since Gallup began tracking economic confidence daily in January 2008. The monthly high point was -7 in May 2013, while the low point was -60 in October 2008 during the Wall Street financial crisis.
The December results are based on Gallup Daily tracking interviews, conducted by landline and cellphone with more than 13,000 U.S. adults.
Americans' assessments of current U.S. economic conditions and their perceptions of whether the economy is getting better or worse -- the two components that make up Gallup's Economic Confidence Index -- improved in December.
The net current conditions score rose to -19 from -23 in November, and now matches September's score. Last month, 18% of Americans said the economy was excellent or good, while 37% said it was poor. The monthly net current conditions score has not moved out of negative territory since Gallup began Daily tracking, although it came close in January 2008, at -1.
The net economic outlook score grew to -19 from -27 in November, and now sits just below the -18 measured in September. The December score reflects 38% of Americans saying the economy is getting better and 57% saying it is getting worse. Americans' views on the economy's direction peaked at -1 in May 2013.
Americans' economic outlook varied more than their views of the current state of the economy in 2013, which has typically been the case since 2008.
Confidence Continues to Improve Across Income and Partisan Groups
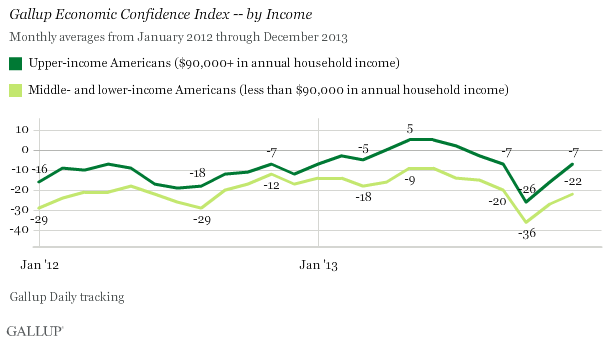
Upper-income Americans' confidence score surged to -7 in December from -16 in November. Middle- and lower-income Americans' confidence improved, but not as much. The index among this group was -22 in December, up from -27 in November.
Upper-income Americans remain significantly more upbeat about the economy. Their index entered positive territory from May through July 2013, but slipped back into the negative zone in August. On the other hand, middle- and lower-income Americans' confidence has never left negative territory, peaking at -9 in May and June.
Similarly, confidence increased across partisan groups in December. Republicans' confidence improved the most, rising 10 points to -40. Democrats' confidence rose seven points to +11, while independents' confidence inched up three points to -25.
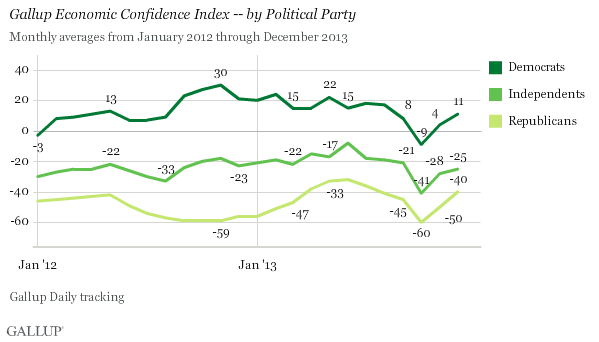
Democrats are the only group with a positive index score among gender, age, regional, income, and party subgroups. Confidence improved across all key subgroups in December compared with November.
Implications
Americans' confidence in the economy improved for the second straight month after plummeting during the federal government shutdown. While Americans' relief after the shutdown undoubtedly contributed to the confidence boost, the index's recovery was likely aided by record-high stock prices, government reports of declining unemployment, and a strong housing market.
Gallup's Economic Confidence Index is off to a strong start this year, improving four points to -13 for the week ending Jan. 5. But if the index is to enter positive territory in 2014, confidence will likely need to rise among middle- and lower-income Americans. Confidence has increased across income groups since October, but upper-income Americans are much closer to the plus side than middle- and lower-income Americans are. Middle- and lower- income Americans will likely need to see a noticeable increase in their paychecks to feel more upbeat about the economy.
Gallup.com reports results from these indexes in daily, weekly, and monthly averages and in Gallup.com stories. Complete trend data are always available to view and export in the following charts:
Daily: Employment, Economic Confidence, Job Creation, Consumer Spending
Weekly: Employment, Economic Confidence, Job Creation, Consumer Spending
Read more about Gallup's economic measures.
View our economic release schedule.
Survey Methods
Results for this Gallup poll are based on telephone interviews conducted Dec. 1-29, 2013, on the Gallup Daily tracking survey, with a random sample of 13,187 adults, aged 18 and older, living in all 50 U.S. states and the District of Columbia.
For results based on the total sample of national adults, the margin of sampling error is ±2 percentage points at the 95% confidence level.
Interviews are conducted with respondents on landline telephones and cellular phones, with interviews conducted in Spanish for respondents who are primarily Spanish-speaking. Each sample of national adults includes a minimum quota of 50% cellphone respondents and 50% landline respondents, with additional minimum quotas by region. Landline and cell telephone numbers are selected using random-digit-dial methods. Landline respondents are chosen at random within each household on the basis of which member had the most recent birthday.
Samples are weighted to correct for unequal selection probability, nonresponse, and double coverage of landline and cell users in the two sampling frames. They are also weighted to match the national demographics of gender, age, race, Hispanic ethnicity, education, region, population density, and phone status (cellphone only/landline only/both, and cellphone mostly). Demographic weighting targets are based on the March 2012 Current Population Survey figures for the aged 18 and older U.S. population. Phone status targets are based on the July-December 2011 National Health Interview Survey. Population density targets are based on the 2010 census. All reported margins of sampling error include the computed design effects for weighting.
In addition to sampling error, question wording and practical difficulties in conducting surveys can introduce error or bias into the findings of public opinion polls.
For more details on Gallup's polling methodology, visit www.gallup.com.
