PRINCETON, NJ -- As electronics enthusiasts gather in Las Vegas for the International Consumer Electronics Show this week, a new Gallup analysis finds Americans falling into four groups according to their ownership levels of the electronic devices already available. At one end of the spectrum, 31% are "Super Tech Adopters," who report broad ownership of the major computing and entertainment devices on the market. At the other extreme, 28% are "Tech-Averse Olders," who own little more than a basic cellphone and DVD player.
Between the extremes, 19% of Americans could be considered "Smartphone Reliants." These Americans are highly likely to have a smartphone, but far less likely than Super Tech Adopters to own other electronics, particularly other portable devices. Additionally, "Mature Technophiles" -- 22% of the public -- report broad ownership of a variety of home electronics, but less than half have smartphones.
These findings are based on a special statistical analysis of data from Gallup's 2013 Lifestyle survey, conducted Dec. 5-8, and highlight unique patterns in the types of communication, entertainment, and computing devices Americans choose to rely on.
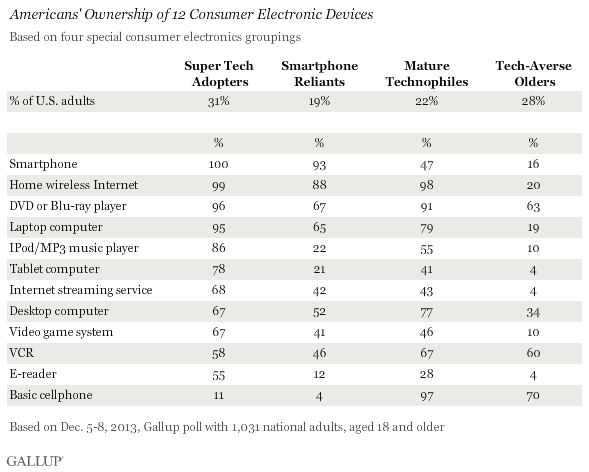
As Gallup reported Monday, DVD/Blu-ray players, home wireless Internet access, laptop computers, and smartphones are among the most prevalent electronics in Americans' homes. But smartphones -- defined in the survey as "a cellular phone that has built-in applications and Internet access, such as an iPhone or Android"-- are much more concentrated among certain groups than others. Overall, 62% of Americans say they personally have a smartphone, but this ranges from 100% among Super Tech Adopters and 93% among Smartphone Reliants to 47% among Mature Technophiles and 16% among Tech-Averse Olders.
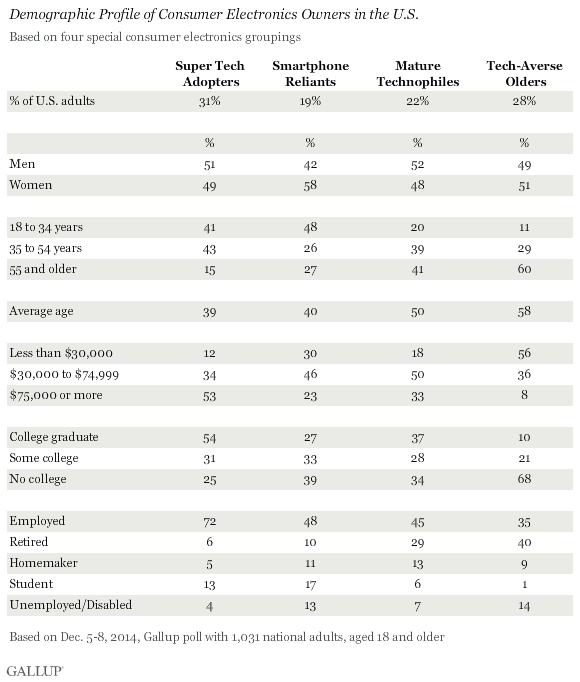
Despite their similarly high rates of smartphone ownership, Super Tech Adopters are much more likely than Smartphone Reliants to earn $75,000 or more, 53% vs. 23%. Thus, income alone doesn't explain who embraces smartphones. Age may be the greater factor, as the average age of the two highest smartphone-using groups is near 40, compared with 50 or older for the two lowest smartphone-using groups.
Here is a more detailed look at each of the four consumer electronics groups in the U.S.:
Super Tech Adopters
"Super Tech Adopters" describes 31% of U.S. adults. These might be viewed as the front line of technological change in society -- those most likely to own a wide variety of electronic devices, and therefore representing the prime customers for the products being unveiled at this week's 2014 Consumer Electronics Show. One hundred percent have a smartphone, 99% have wireless Internet at home, 95% have a laptop computer, 86% have an iPod or MP3 music player, 78% have a tablet, and 67% have a desktop computer.
Their average age is 39. The majority (54%) are college graduates, and nearly three-quarters (72%) are employed full or part time. Roughly half (53%) earn $75,000 or more per year, while only 12% earn less than $30,000.
Smartphone Reliants
"Smartphone Reliants" represent 19% of Americans. Nearly all (93%) have a smartphone, 65% have a laptop, and most have wireless at home; but they are far less likely than their affluent counterparts to have electronic perks such as tablets, e-readers, and portable music devices, or to subscribe to Internet streaming services. Their relatively low ownership of iPods, tablets, and e-readers suggests they may have chosen to rely on their smartphones for these capabilities.
This group's average age (40) is similar to that of Super Tech Adopters, but Smartphone Reliants are less likely to be college educated, less likely to be employed, and less affluent. At 58% female, they also have a higher proportion of women than any of the other three groups.
Mature Technophiles
The third group -- "Mature Technophiles" -- is also a natural target for consumer electronics marketers. It reports broad ownership of most electronic devices, with higher ownership of desktop and laptop computers, tablets, e-readers, portable music players, and DVD or Blu-ray devices than Smartphone Reliants. Members of this group are just far less likely to have a smartphone.
Mature Technophiles have slightly higher incomes and more formal education than Smartphone Reliants, but they are older, averaging 50 years. It is this last difference that most likely explains their aversion to smartphones.
Tech-Averse Olders
Rough three in 10 Americans are "Tech Averse Olders." They average 58 years of age, and 40% are retired. The vast majority -- 84% -- do not have a smartphone. While seven in 10 have a basic cellphone, the only other consumer electronics embraced by the majority are VCRs and DVD players. To the extent they have a computer, it's more likely to be a desktop than a laptop, and only 20% have Wi-Fi in their homes.
In addition to their advanced age, other barriers to updating their outdated technology could be income and education. The majority of Tech-Averse Olders make less than $30,000 per year, and two-thirds did not attend college.
Bottom Line
Gallup's "cluster analysis" of Americans' personal choices in consumer electronics identifies four categories of Americans relative to their ownership patterns. At the extremes, 31% are, on average, well-to-do, relatively young, and own a wide variety of computing and entertainment devices, while 28% are significantly older, lower income, and tech averse. In between, 19% of Americans mainly have smartphones and laptops, but are light on other portable devices, possibly a reflection of their lower income and employment levels. Another 22% mainly use traditional cellphones, perhaps a function of their more advanced age, but they report relatively high ownership of other devices.
Some of the electronics generating the most buzz this week in Las Vegas include wearable technology, and more generally improving the performance of "things" by embedding wireless modules that can collect and transmit key information. Others involve 3-D printing or curved screens. None of the associated companies has yet rocked the electronics world, but each will try to advance its products by appealing directly to consumers. According to the Gallup findings, about three in 10 Americans -- the Super Tech Adopters -- would seem to be prime targets for these marketers, but Mature Technophiles also exhibit an interest in new technologies, and have some ability to make expensive purchases.
Additionally, at a time when there is much high-level focus on income inequality in the U.S., these analyses highlight a powerful electronics disparity in the country. Only in this case, income isn't necessarily the sole factor blocking access to new technologies. Age -- or, more specifically, the comfort level with technology associated with age -- could also be important. Regardless, the implications of these differences are potentially countless -- from how people in the various groups communicate, interact socially, stay informed, and generally spend their time, to how they receive messages from others, including elected officials, candidates, and advertisers.
John Reimnitz, Gallup Advanced Design and Analytics Specialist, contributed to this story.
Survey Methods
Results for this Gallup poll are based on telephone interviews conducted Dec. 5-8, 2013, with a random sample of adults, aged 18 and older, living in all 50 U.S. states and the District of Columbia.
For results based on the total sample of 1,031 national adults, the margin of sampling error is ±4 percentage points at the 95% confidence level.
Interviews are conducted with respondents on landline telephones and cellular phones, with interviews conducted in Spanish for respondents who are primarily Spanish-speaking. Each sample of national adults includes a minimum quota of 50% cellphone respondents and 50% landline respondents, with additional minimum quotas by region. Landline and cell telephone numbers are selected using random-digit-dial methods. Landline respondents are chosen at random within each household on the basis of which member had the most recent birthday.
Samples are weighted to correct for unequal selection probability, nonresponse, and double coverage of landline and cell users in the two sampling frames. They are also weighted to match the national demographics of gender, age, race, Hispanic ethnicity, education, region, population density, and phone status (cellphone only/landline only/both, and cellphone mostly). Demographic weighting targets are based on the March 2012 Current Population Survey figures for the aged 18 and older U.S. population. Phone status targets are based on the July-December 2011 National Health Interview Survey. Population density targets are based on the 2010 census. All reported margins of sampling error include the computed design effects for weighting.
In addition to sampling error, question wording and practical difficulties in conducting surveys can introduce error or bias into the findings of public opinion polls.
For more details on Gallup's polling methodology, visit www.gallup.com.