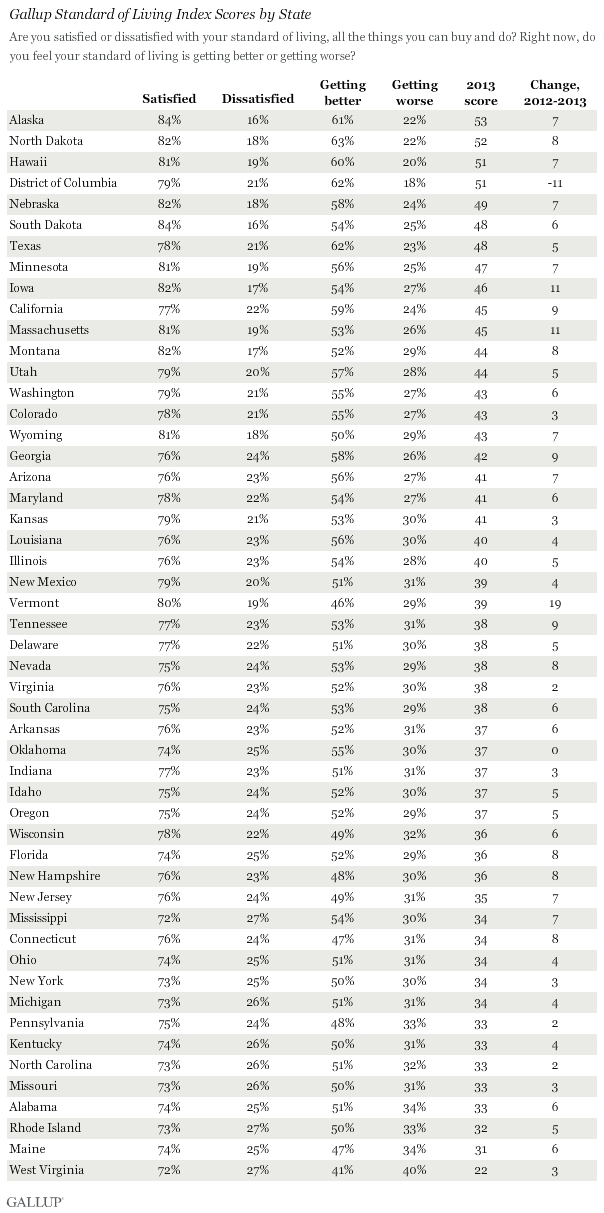
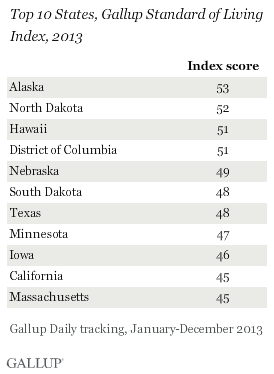
WASHINGTON, D.C. -- Among residents of the 50 states, Alaskans were the most satisfied with and optimistic about their standard of living in 2013, according to Gallup's Standard of Living Index. Alaska's average index score of 53 was similar to the scores in North Dakota and Hawaii, but far outpaced West Virginia's bottom-ranking score of 22. The national index improved to 38 in 2013, up from 34 in 2012, with marginal improvements in nearly all states.
 |
| Explore complete state data > |
The Standard of Living Index is a composite of Americans' satisfaction with their standard of living on the basis of two questions: one asking whether they are satisfied with their current standard of living, and the other asking whether their standard of living is getting better or worse. The index has a theoretical maximum of 100 (if all respondents say they are satisfied with their standard of living and say it is getting better) and a theoretical minimum of -100 (if all respondents are dissatisfied with their standard of living and say it is getting worse).
Following Alaska in the top 10 were North Dakota (52), Hawaii (51), and the District of Columbia (51). These states were joined by Nebraska (49), South Dakota (48), Texas (48), and Minnesota (47), all of which ranked in the top 10 in 2012.
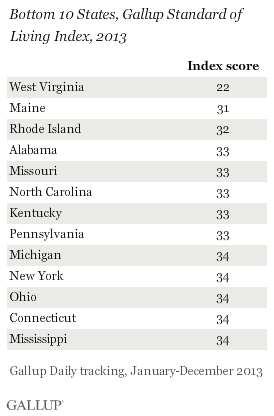
West Virginia had the lowest Standard of Living Index reading (22), a distinction it also held in 2012. Also in the bottom 10 were Maine (31) and Rhode Island (32), both repeats from 2012.
Standard of Living and Its Relationship to Economic Confidence and Job Creation
Generally speaking, states that ranked highest in economic confidence and job creation also reported their standard of living to be higher. Of the top 10 states with the highest economic confidence and job creation, eight from each list were in the top 10 for standard of living.
North Dakota, which surpassed all other states in perceptions of job creation in 2013, found itself at No. 2 for standard of living. The District of Columbia, Nebraska, South Dakota, Texas, and Minnesota also scored high in state rankings for both the Job Creation and Standard of Living Indexes.
Vermont Residents See Biggest Improvement
The most improved state was Vermont, which climbed 19 points from last year to an index reading of 39. Vermont had been on the lower end of the bottom 10 in 2012, but its standard of living improved so greatly in 2013 that it is no longer on the bottom 10 list. This may be attributed to Vermont's jump of 11 points in the Economic Confidence Index from 2012 to 2013.
Marked improvements in perceived standard of living were also seen in Iowa (46) and Massachusetts (45), both of which improved 11 points from 2012. California (45) improved by nine points. None of these three were in the top 10 in 2012, but improved so greatly that they comprised the latter end of the top 10 in 2013. Iowa, Massachusetts, and California all experienced gains in either the Economic Confidence or Job Creation Index last year.
In the District of Columbia, the Standard of Living Index dropped 11 points in 2013, which was the only decrease from 2012. Still, it ranks among the states with the highest Standard of Living Index scores.
For full results by state, see page 2.
The Last Frontier: An Unlikely Leader in Standard of Living
Despite standard of living's correlations with the Job Creation and Economic Confidence Indexes, one state -- Alaska -- has been a true outlier for standard of living.
Considering its dismally low score in economic confidence, Alaska may seem an improbable state to lead the pack on the Standard of Living Index. Though high rankings in standard of living usually indicate higher scores for job creation and/or economic confidence, Alaska is an extreme exception, ranking among the lowest in the nation for economic confidence. It was also one point away from being included in the bottom 10 for job creation.
Alaska's high standard of living reading could reflect its unique distinction of being the only state with neither a state income tax nor a state sales tax. In fact, three of the seven states with no income tax -- Alaska, South Dakota, and Texas -- have been in the top 10 for the past three years. Two others, Washington and Wyoming, were just a few points short of being in the 2013 top 10. Alaska only fell to second place in standard of living in 2012, when it was superseded by the District of Columbia. With the exception of 2012, Alaska has led this list each year since 2009.
Additionally, Alaska has a unique landscape ripe for many of nature's most exciting outdoor activities, and this may provide a physical environment conducive to a high standard of living for Alaskans. Removed from the continental United States, residents in Alaska may define "high standard of living" differently, partly factoring in the life-enriching opportunities that nature freely provides.
Implications
Perceptions of job creation and economic confidence clearly have an impact on standard of living in the United States. For Alaskans, however, these perceptions might be irrelevant toward their views on their standard of living, as their lives are virtually untaxed by their state government and they are removed from the fast pace of the continental U.S.
Though the lowest-ranking states remained largely the same from 2012, nearly all states witnessed increases, reflecting the national four-point increase to a reading of 38. It may be said that states that improve perceptions of economic confidence and/or job creation could realize concurrent gains in standard of living ratings over time.
Gallup's "State of the States" series reveals state-by-state differences on political, economic, and well-being measures Gallup tracks each day. New stories based on full-year 2013 data will be released in the coming months.
Gallup.com reports results from these indexes in daily, weekly, and monthly averages and in Gallup.com stories. Complete trend data are always available to view and export in the following charts:
Daily: Employment, Economic Confidence, Job Creation, Consumer Spending
Weekly: Employment, Economic Confidence, Job Creation, Consumer Spending
Read more about Gallup's economic measures.
View our economic release schedule.
Survey Methods
Results for this Gallup poll are based on telephone interviews conducted Jan. 2-Dec. 29, 2013, on the Gallup Daily tracking survey, with a random sample of 178,068 adults, aged 18 and older, living in all 50 U.S. states and the District of Columbia.
For results based on the total sample of national adults, one can say with 95% confidence that the margin of sampling error is ±1 percentage point.
Margins of error for individual states are no greater than ±6 percentage points, and are ±3 percentage points in most states. The margin of error for the District of Columbia is ±6 percentage points.
Interviews are conducted with respondents on landline telephones and cellphones, with interviews conducted in Spanish for respondents who are primarily Spanish-speaking. Each national sample includes a minimum quota of 400 cellphone respondents and 600 landline respondents per 1,000 national adults, with additional minimum quotas among landline respondents by region. Landline telephone numbers are chosen at random among listed telephone numbers. Cellphone numbers are selected using random-digit-dial methods. Landline respondents are chosen at random within each household on the basis of which member had the most recent birthday.
State samples are weighted to be representative of the state's adult population by gender, age, race, Hispanic ethnicity, and education, region based on the March 2012 Current Population Survey. All reported margins of sampling error include the computed design effects for weighting.
In addition to sampling error, question wording and practical difficulties in conducting surveys can introduce error or bias into the findings of public opinion polls.
For more details on Gallup's polling methodology, visit www.gallup.com.