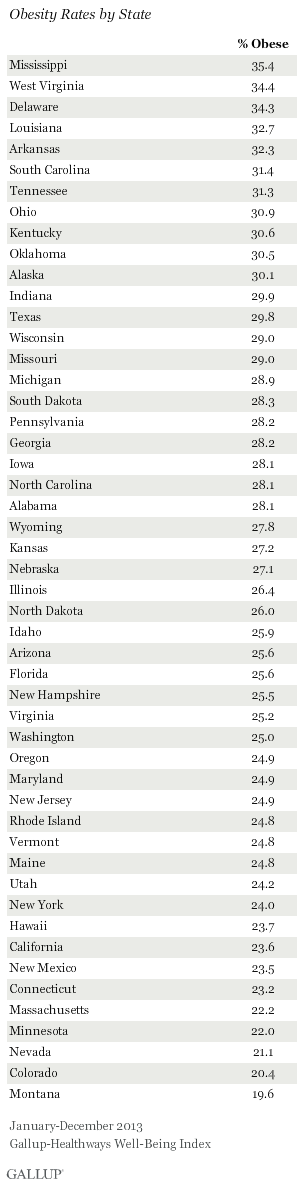
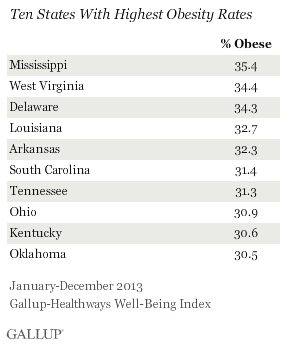
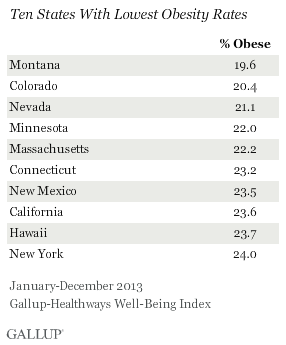
WASHINGTON, D.C. -- Mississippi had the highest obesity rate in the U.S. in 2013, at 35.4%, while Montana has the lowest rate, at 19.6%. The obesity rate has generally increased across the U.S. each year since 2008.
From 2010 through 2012, West Virginia maintained the highest obesity rate nationwide while Colorado had the lowest. Five states -- Mississippi, West Virginia, Louisiana, Arkansas, and Kentucky -- have been listed among the 10 states with the highest obesity rates in the nation since 2008. Colorado, Massachusetts, Connecticut, and California have routinely been states with lower levels of obesity -- all four have made the list of the 10 states with the lowest obesity rates in the nation each year since 2008.
 |
| Explore complete state data > |
The national obesity rate, as computed by respondents' self-reported height and weight in the Gallup-Healthways Well-Being Index, has increased to 27.1% from 26.2% in 2012, and is up 1.6 percentage points from 25.5% in 2008, Gallup's initial year of tracking. Americans who have a BMI of 30 or higher are classified as obese.
More than two in 10 adults were obese in nearly every state in 2013, with the exception of Montana. Three in 10 adults were obese in 11 states -- Mississippi, West Virginia, Delaware, Louisiana, Arkansas, South Carolina, Tennessee, Ohio, Kentucky, Oklahoma, and Alaska -- compared with only five states in 2012. Obesity rates continue to be highest in Southern and Midwestern states and lowest in Western and Northeastern states, a trend that has been ongoing since Gallup and Healthways began tracking the obesity rate in 2008.
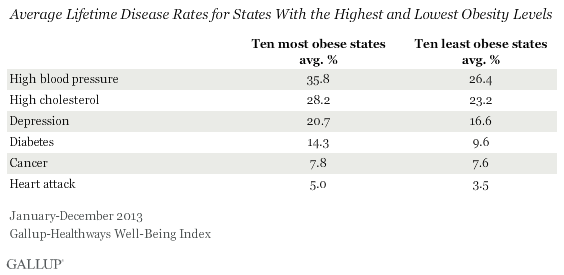
Chronic Diseases Are More Prevalent in the Most Obese States
Those living in the 10 states with the highest levels of obesity are more likely to report having had a diagnosis of chronic disease at some point in their lives, including high blood pressure, high cholesterol, depression, diabetes, cancer, and heart attacks, than are those living in the 10 states with the lowest obesity rates. Gallup-Healthways data show an average 35.8% of Americans living in the 10 states with the highest obesity rates report a high blood pressure diagnosis, while 26.4% of Americans living in the 10 least obese states say the same -- a difference of 9.4 points.
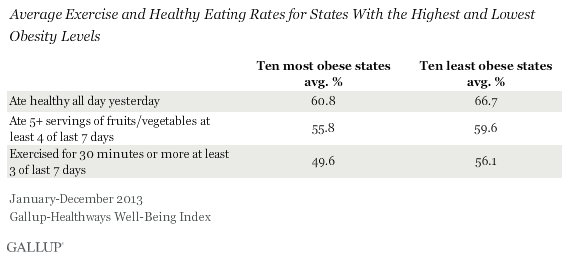
Residents in Least Obese States Eat Healthier and Exercise More
Americans living in the 10 states with the lowest rates of obesity also report higher instances of healthy eating and exercise than do those who live in the 10 states with the highest obesity levels. For example, an average 66.7% of those living in the 10 least obese states say they ate healthy all day yesterday compared with 60.8% of those living in the 10 most obese states.
Bottom Line
As the rate of obesity among U.S. adults continues to increase across all 50 states, health issues and costs associated with the chronic diseases that can accompany obesity will continue to rise. Gallup-Healthways Well-Being Index data show Americans are not eating as healthily or exercising as often as in past years, which might play a role in the increase of national and state obesity rates.
"While there are a variety of factors that are often correlated with rising obesity rates, such as an unhealthy food environment, poor eating habits, increasing portion sizes, and inactivity, experts agree that the health consequences of obesity are real," Dr. James E. Pope, Senior Vice President and Chief Science Officer at Healthways said. "Research has shown that the average healthcare costs for an obese individual are over $1,300 more annually than someone who is not obese. Although slowing and even reversing this trend may seem daunting, even modest weight loss of 5% to 10% of initial body weight can lower the health risks associated with obesity," added Pope.
The American Medical Association in June 2013 recognized obesity as a disease, which may affect the way medical professionals discuss and treat obesity. Additionally, the CDC released new data reporting obesity rates among children aged two to five years have dropped 43% in the past decade. Although the Gallup-Healthways Well-Being Index does not track childhood obesity rates, the CDC data is an encouraging sign that progress is being made in this area. Efforts to curb childhood obesity in America may positively affect adult obesity rates across all states in the years ahead. Specifically, these efforts may lead to fewer Americans entering adulthood overweight, while also encouraging overweight adults to make healthier lifestyle choices.
Gallup's "State of the States" series reveals state-by-state differences on political, economic, and well-being measures Gallup tracks each day. New stories based on full-year 2013 data will be released in the coming months.
Survey Methods
Results are based on telephone interviews conducted as part of the Gallup-Healthways Well-Being Index survey Jan. 2-Dec. 29, 2013, with a random sample of 178,072 adults, aged 18 and older, living in all 50 U.S. states and the District of Columbia.
The margin of sampling error for most states is ±1 to ±2 percentage points, but is as high as ±4 points for states with smaller populations, such as Wyoming, North Dakota, South Dakota, Delaware, and Hawaii.
Interviews are conducted with respondents on landline telephones and cellular phones, with interviews conducted in Spanish for respondents who are primarily Spanish-speaking. Each sample of national adults includes a minimum quota of 50% cellphone respondents and 50% landline respondents, with additional minimum quotas by time zone within region. Landline and cellular telephone numbers are selected using random-digit-dial methods. Landline respondents are chosen at random within each household on the basis of which member had the most recent birthday.
Samples are weighted to correct for unequal selection probability, nonresponse, and double coverage of landline and cell users in the two sampling frames. They are also weighted to match the national demographics of gender, age, race, Hispanic ethnicity, education, region, population density, and phone status (cellphone only/landline only/both, and cellphone mostly). Demographic weighting targets are based on the most recent Current Population Survey figures for the aged 18 and older U.S. population. Phone status targets are based on the most recent National Health Interview Survey. Population density targets are based on the most recent U.S. census. All reported margins of sampling error include the computed design effects for weighting.
In addition to sampling error, question wording and practical difficulties in conducting surveys can introduce error or bias into the findings of public opinion polls.
For more details on Gallup's polling methodology, visit www.gallup.com.