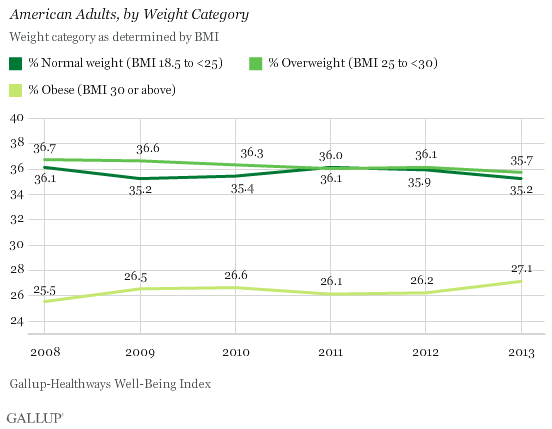
WASHINGTON, D.C. -- In the U.S., 27.1% of adults were obese in 2013, the highest rate measured since Gallup and Healthways began tracking in 2008. The obesity rate increased by nearly a full percentage point over the average rate of 26.2% found in 2012. As more Americans moved into the obese category in 2013, slightly fewer Americans were classified as overweight or as normal weight.
The Gallup-Healthways Well-Being Index, which uses respondents' self-reports of their height and weight to calculate body mass index (BMI) scores, differs slightly from government reports of obesity, which are based on actual heights and weights found in clinical measurements. A recent government report based on the National Health and Nutrition Examination Survey found that 34.9% of adults, aged 20 years or older, in the study were obese. This rate had not significantly changed between 2003 and 2012.
Gallup and Healthways began tracking U.S. adults' weight daily in 2008. Individual BMI values of 30 or above are classified as "obese," 25 to 29.9 are "overweight," 18.5 to 24.9 are "normal weight," and 18.4 or less are "underweight." For the past six years, nearly two-thirds of Americans have had BMIs higher than is recommended, while roughly 35% of Americans have been in the "normal weight" category.
The World Health Organization further classifies BMIs of 30.00 or higher into one of three classes of obesity:
- Obese class I = 30.00 to 34.99
- Obese class II = 35.00 to 39.99
- Obese class III = 40.00 or higher
Those with BMIs of 40 or higher -- obese class III -- are often considered "morbidly obese." According to Americans' self-reports of height and weight, the percentage of morbidly obese has been slowly rising since 2011, and is now the highest Gallup has recorded, at 3.8%.
The percentage of Americans in obese class II has also been on the rise, reaching a record high of 6.3% in 2013. The percentage in obese class I has varied, but the 17.1% who fall into this group matches the highest rate recorded since tracking began. Thus, the overall increase in obesity in 2013 reflects an upward shift among all three obesity groups.
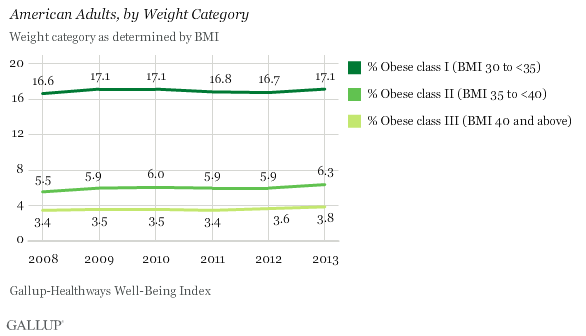
The majority of Americans who are obese fall into obese class I, which means they have less weight to lose to move into the overweight or, ideally, the normal weight category. But the increase in the percentage in the U.S. who fall into obesity classes II and III is troubling, given the fiscal and physical costs of obesity.
All Demographic Groups See Stable or Increasing Obesity Rates
The obesity rates across all major demographic and socioeconomic groups in the U.S. increased at least marginally in 2013 compared with 2012, with the exception of 18- to 29-year-olds. These increases ranged from 0.6 percentage points among Americans living in the East to 1.8 points for 45- to 64-year-olds.
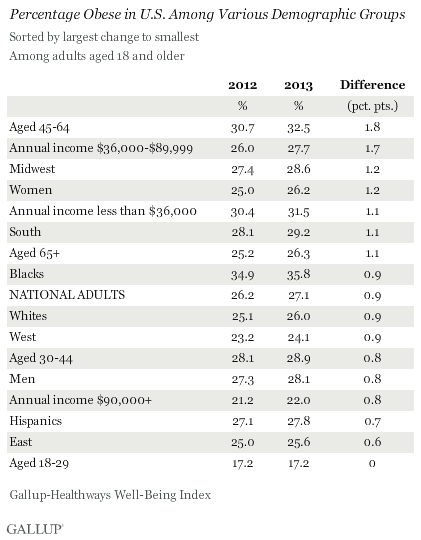
Some of the groups with the highest obesity rates saw the largest increases from 2012 to 2013. The obesity rate increased by more than one point among Americans who make less than $36,000 a year, 45- to 64-year-olds, and those living in the South. The obesity rate among black Americans, already the highest rate recorded among major demographic groups, rose 0.9 points to 35.8% in 2013.
Implications
Obesity is linked to increased health risks and lower productivity rates among workers of all industries. A high obesity rate can hold a country back, both in national well-being and in economic productivity.
Obesity increases the risk of many serious and costly medical conditions and leads to increased healthcare costs and workplace absenteeism, which negatively affect the U.S. economy. If more Americans become obese, these costs will continue to climb.
Americans' eating habits worsened in 2013, which may have contributed to the uptick in the obesity rate along with the fact that Gallup found Americans were exercising less in first half of 2013. Furthermore, while many Americans say they want to lose weight, few are actively trying to do so.
President Barack Obama and first lady Michelle Obama have emphasized the importance of healthy eating and exercise, especially for children, throughout their time in the White House. Further, national restaurant chains are providing more healthy options in their children's meals, like fruit and vegetable options as sides. Though the rate of childhood obesity -- which the Gallup-Healthways Well-Being Index does not track -- has dropped over the last decade, it is yet to be seen whether it will lead to lower adult obesity rates in the years to come.
That the obesity rate increased across almost all demographic groups in 2013 suggests this is not an issue in one region, age group, or income bracket; it is a national problem.
About the Gallup-Healthways Well-Being Index
The Gallup-Healthways Well-Being Index tracks well-being in the U.S. and provides best-in-class solutions for a healthier world. To learn more, please visit well-beingindex.com.
Survey Methods
Results are based on telephone interviews conducted as part of the Gallup-Healthways Well-Being Index survey Jan. 2-Dec. 29, 2013, with a random sample of 178,072 adults, aged 18 and older, living in all 50 U.S. states and the District of Columbia.
For results based on the total sample of national adults, the margin of sampling error is ±0.3 percentage points at the 95% confidence level. For the various subgroups, the sampling error will range from ±0.5 to ±1.5 percentage points.
Interviews are conducted with respondents on landline telephones and cellular phones, with interviews conducted in Spanish for respondents who are primarily Spanish-speaking. Each sample of national adults includes a minimum quota of 50% cellphone respondents and 50% landline respondents, with additional minimum quotas by time zone within region. Landline and cellular telephone numbers are selected using random-digit-dial methods. Landline respondents are chosen at random within each household on the basis of which member had the most recent birthday.
Samples are weighted to correct for unequal selection probability, nonresponse, and double coverage of landline and cell users in the two sampling frames. They are also weighted to match the national demographics of gender, age, race, Hispanic ethnicity, education, region, population density, and phone status (cellphone only/landline only/both, and cellphone mostly). Demographic weighting targets are based on the most recent Current Population Survey figures for the aged 18 and older U.S. population. Phone status targets are based on the most recent National Health Interview Survey. Population density targets are based on the most recent U.S. census. All reported margins of sampling error include the computed design effects for weighting.
In addition to sampling error, question wording and practical difficulties in conducting surveys can introduce error or bias into the findings of public opinion polls.
For more details on Gallup's polling methodology, visit www.gallup.com.
