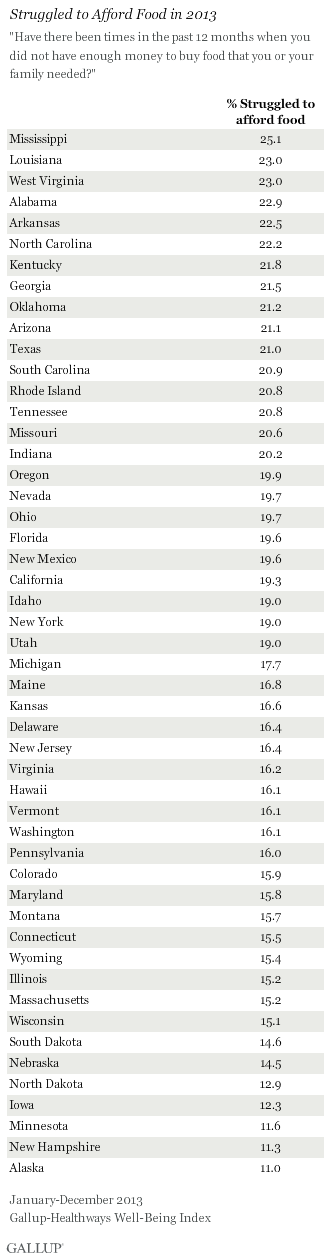
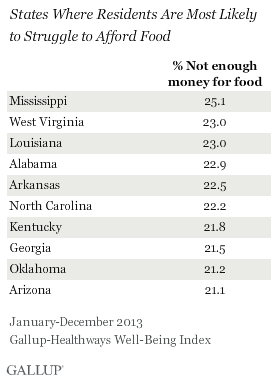
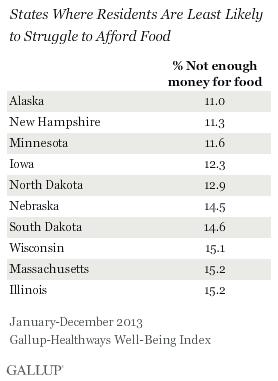
WASHINGTON, D.C. -- For the sixth consecutive year, Mississippians were the most likely in the U.S. to report struggling to afford food. In 2013, 25.1% report there was at least one time in the last 12 months when they did not have enough money to buy the food they or their families needed. Residents in West Virginia, Louisiana, and Alabama were also among the most likely to struggle to afford food. Residents of Alaska, New Hampshire, and Minnesota were among the least likely to have this problem.
These findings are from surveys conducted with more than 178,000 U.S. adults in 2013 as part of the Gallup-Healthways Well-Being Index. Gallup asks 500 Americans each day if there have been times in the past 12 months when they did not have enough money to buy food that they or their families needed.
 |
| Explore complete state data > |
In 16 states, at least one in five residents said they struggled to afford the food that they or their families needed at least once in the past 12 months. In seven states, less than 15% of residents reported the same struggles in 2013.
Alabama has been among the 10 states most likely to report struggling to afford food in each of the six years Gallup and Healthways have tracked this measure. Louisiana, Arkansas, and Georgia are also frequent visitors on this list, with each state appearing five times since tracking began. Other repeat states among the 10 most likely to report struggling to afford food are West Virginia, North Carolina, South Carolina, Kentucky, and Oklahoma -- each making the list four of the last six years. This is the first time Arizona has been among the 10 states reporting the highest percentage of residents who struggled to afford food.
Those states with the lowest percentage of residents who reported struggling to afford food show more movement from year to year than those states with the highest rates. Only Minnesota and North Dakota have been listed among the states with the lowest food hardship rates for all six years of tracking. South Dakota, Massachusetts, Wisconsin, and Iowa have been in this group for five of six years. Alaska, the state with the lowest percentage in 2013, has appeared among this group once before, in 2009, when 15.4% of its residents reported struggling to afford food.
As a nation, Americans were slightly more likely to struggle to afford food in 2013 compared with prior years. In 2013, 18.9% struggled to afford food nationally, compared with 18.2% in 2012 and 17.8% in 2008, the lowest rate Gallup has recorded since tracking began in 2008.
Americans' growing struggles to afford food may be linked to a rise in food prices across the country, particularly meat prices, while national incomes have largely flat-lined since the recession. Trouble affording food may also be linked to the national rise in unhealthy eating habits in 2013 and the uptick in the obesity rate.
Residents in Southern States Report Struggling More to Afford Food
There are wide disparities across regions in the percentage of residents who at times lacked the money to purchase the food they or their families needed. Southern states tend to have higher percentages of residents who report struggling, whereas Midwestern states report lower percentages.
Implications
More Americans in 2013 reported struggling to afford food than in 2012. While seven states reported less than 15% of residents struggling, 16 states -- more than twice as many -- reported that at least one in five residents struggled in 2013.
To address this issue, states try to help their struggling residents afford food by offering food assistance programs. However, Congress passed an update to the Farm Bill in early 2014 that cuts approximately $8 billion from national food assistance programs over the next decade. This could make it harder for states to help their residents who struggle to afford food. Some states are trying to fight these cuts to continue to provide food assistance for their residents, but rising food prices nationally could make food affordability an even bigger issue in the coming year, regardless of the cuts.
While food assistance programs help residents avoid going hungry, providing quality jobs and increasing average income could do more to help citizens have the money they need to afford food.
Gallup's "State of the States" series reveals state-by-state differences on political, economic, and well-being measures Gallup tracks each day. New stories based on full-year 2013 data will be released in the coming months.
Survey Methods
Results are based on telephone interviews conducted as part of the Gallup-Healthways Well-Being Index survey Jan. 2-Dec. 29, 2013, with a random sample of 178,067 adults, aged 18 and older, living in all 50 U.S. states and the District of Columbia.
For results based on the total sample of national adults, the margin of sampling error is ±1 percentage points at the 95% confidence level.
The margin of sampling error for most states is ±1 to ±2 percentage points, but is as high as ±4 points for states with smaller populations, such as Wyoming, North Dakota, South Dakota, Delaware, and Hawaii.
Interviews are conducted with respondents on landline telephones and cellular phones, with interviews conducted in Spanish for respondents who are primarily Spanish-speaking. Each sample of national adults includes a minimum quota of 50% cellphone respondents and 50% landline respondents, with additional minimum quotas by time zone within region. Landline and cellular telephone numbers are selected using random-digit-dial methods. Landline respondents are chosen at random within each household on the basis of which member had the most recent birthday.
Samples are weighted to correct for unequal selection probability, nonresponse, and double coverage of landline and cell users in the two sampling frames. They are also weighted to match the national demographics of gender, age, race, Hispanic ethnicity, education, region, population density, and phone status (cellphone only/landline only/both, and cellphone mostly). Demographic weighting targets are based on the most recent Current Population Survey figures for the aged 18 and older U.S. population. Phone status targets are based on the most recent National Health Interview Survey. Population density targets are based on the most recent U.S. census. All reported margins of sampling error include the computed design effects for weighting.
In addition to sampling error, question wording and practical difficulties in conducting surveys can introduce error or bias into the findings of public opinion polls.
For more details on Gallup's polling methodology, visit www.gallup.com.