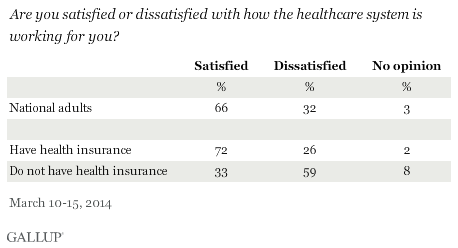
PRINCETON, NJ -- Two-thirds of Americans are satisfied with the way the healthcare system is working for them today. Health insurance status is a major determinant of this satisfaction, but even one-third of those who don't have health insurance still say they are satisfied.
This question was asked during March 10-15 interviewing as a basic summary indicator of how well the healthcare system is working for individual Americans.
Healthcare insurance status is the most important dividing factor in Americans' perceptions of how the healthcare system is working for them, although by no means is having insurance a perfect determinant of their satisfaction. Seventy-two percent of those with health insurance say they are satisfied with the system, leaving about one-quarter who are not. And one-third of those who do not have health insurance still say they are satisfied.
As with any summary question, it is impossible to measure exactly what Americans take into account when they answer. However, research conducted in last November's Gallup Poll Social Series survey on healthcare showed broadly similar results when Americans were asked three questions involving access to healthcare, and the cost and quality of their own healthcare. Overall, 79% rated the quality of healthcare they received as excellent or good, 69% rated their personal healthcare coverage as excellent or good, and 59% were satisfied with the total cost they paid for healthcare.
Thus, Americans may be averaging these three aspects of the healthcare system in answering whether they are satisfied with the way the healthcare system is working for them. Additionally, when this question was asked of a different sample but with the added phrase "including your access to healthcare, and the cost and quality of healthcare you receive," responses were almost identical, reinforcing the conclusion that the basic question represents a valid overall summary measure.
Young and Old Most Likely to Be Satisfied
Although younger Americans are less likely to have health insurance than those who are aged 30 to 64, they are more likely than this middle-aged group to be satisfied with the way the healthcare system is working for them. Seniors aged 65 and older, all of whom are eligible for Medicare, are the most satisfied.
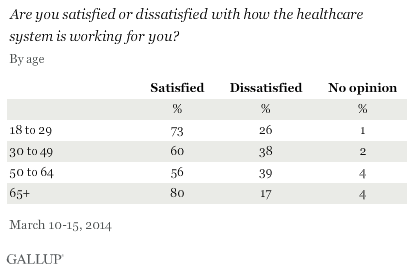
The higher satisfaction level among younger Americans may at least partly reflect that young people tend to be the healthiest -- and therefore may be more inclined to indicate that the system is working fine as far as they are concerned. Additionally, young people may have lower premiums if they don't have families, and they might not have to pay for coverage if they are carried on their parents' policies.
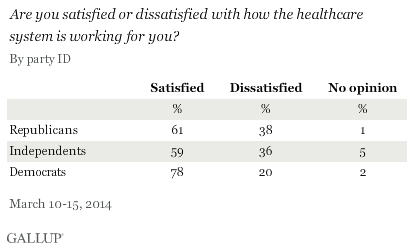
Democrats Significantly More Likely to Be Satisfied
This general satisfaction question does not mention the Affordable Care Act by name, nor does it mention insurance or politics. Regardless, there is a political aspect to the responses. More than three in four Democrats are satisfied with how the healthcare system is working for them, compared with roughly six in 10 independents and Republicans. It is probable that some respondents think about the ACA when any question about healthcare is asked. Previous research shows Democrats are much more likely to approve of the law than anyone else, and some of this attitudinal foundation probably becomes a part of responses to the satisfaction question.
Implications
Most Americans do not believe the healthcare system in this country is in crisis. This may in part reflect the current finding that about two-thirds of Americans are satisfied with the way the healthcare system is working for them, including majorities in most subgroups except those who do not have health insurance.
At the same time, a clear majority of Americans now say they disapprove of the Affordable Care Act. Their disapproval could be because many don't see the need to change the system, and worry that the new legislation will affect a process they currently are satisfied with. President Barack Obama famously argued that under the ACA, those who liked their existing health insurance could keep it. However, in recent months, he has had to backtrack from that statement as news reports suggest that under the new law, some insured Americans may face changes in their policies, including coverage and cost. Their new policies, though they may provide a higher level of benefits, may end up costing them more than their old ones did.
Of course, much of the rationale for the new law involved helping Americans with no health insurance who would clearly benefit from change. With one in three Americans, including the majority of those without insurance, dissatisfied with the way the system is working for them, there is obvious need for this type of help. And, it may be that some of those who approve of the law have a satisfactory health insurance situation, but are motivated by charitable impulses rather than their own self-interest.
Still, Americans' satisfaction with the way the healthcare system is working for them appears to be one of the headwinds facing broad acceptance of the ACA. When a system is seen as working well, it is usually more difficult to propose major changes to it -- particularly when those affected may be worried about unanticipated or negative consequences from those changes.
Survey Methods
Results for this Gallup poll are based on telephone interviews conducted March 10-15, 2014, on the Gallup Daily tracking survey, with a random sample of 1,542 adults, aged 18 and older, living in all 50 U.S. states and the District of Columbia.
For results based on the total sample of national adults, the margin of sampling error is ±3 percentage points at the 95% confidence level.
Interviews are conducted with respondents on landline telephones and cellular phones, with interviews conducted in Spanish for respondents who are primarily Spanish-speaking. Each sample of national adults includes a minimum quota of 50% cellphone respondents and 50% landline respondents, with additional minimum quotas by time zone within region. Landline and cellular telephone numbers are selected using random-digit-dial methods. Landline respondents are chosen at random within each household on the basis of which member had the most recent birthday.
Samples are weighted to correct for unequal selection probability, nonresponse, and double coverage of landline and cell users in the two sampling frames. They are also weighted to match the national demographics of gender, age, race, Hispanic ethnicity, education, region, population density, and phone status (cellphone only/landline only/both, and cellphone mostly). Demographic weighting targets are based on the most recent Current Population Survey figures for the aged 18 and older U.S. population. Phone status targets are based on the most recent National Health Interview Survey. Population density targets are based on the most recent U.S. census. All reported margins of sampling error include the computed design effects for weighting.
In addition to sampling error, question wording and practical difficulties in conducting surveys can introduce error or bias into the findings of public opinion polls.
For more details on Gallup's polling methodology, visit www.gallup.com.