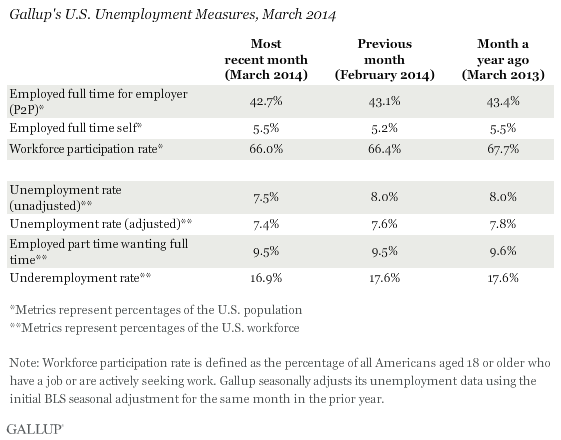
WASHINGTON, D.C. -- The U.S. Payroll to Population employment rate (P2P), as measured by Gallup, was 42.7% in March. This is down slightly from 43.1% in February, but remains slightly up from 42.0% from January. P2P so far in 2014 remains below the averages for 2013 (43.8%) and 2012 (44.4%).
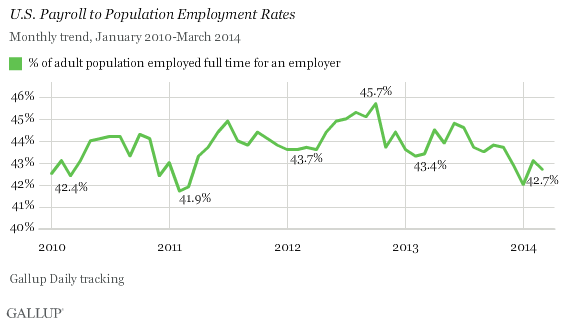
Gallup's P2P metric tracks the percentage of the U.S. adult population aged 18 and older that is employed full time by an employer for at least 30 hours per week. P2P is not seasonally adjusted. However, because of seasonal fluctuations, year-over-year comparisons are often helpful in evaluating whether monthly changes are attributable to seasonal hiring patterns or true growth (or deterioration) in the percentage of people working full time for an employer. On the basis of that comparison, the P2P rate for March 2014 is down slightly compared with the 43.4% found in the same month last year and the 43.7% in March 2012.
The latest results are based on Gallup Daily tracking interviews with approximately 30,000 Americans, conducted March 1-31, by landline telephone and cellphone. Gallup does not count adults who are self-employed, working part time, unemployed, or out of the workforce as payroll-employed in the P2P metric.
Seasonally Adjusted Unemployment 7.4% in March
Unlike Gallup's P2P rate, which is a percentage of the total population, traditional employment metrics, such as the unemployment rates Gallup and the U.S. Bureau of Labor Statistics (BLS) report, are based on the percentage of the workforce. Gallup defines the "workforce" as adults who are working or actively looking for work and available for employment. The U.S. workforce participation rate in March was 66.0%, steady with February's 66.4% but down from 67.7% in March 2013.
Gallup's unadjusted U.S. unemployment rate for March is 7.5%. Gallup's seasonally adjusted U.S. unemployment rate for March, using the government's prior adjustment factors, is 7.4%. Gallup calculates this rate by applying the adjustment factor the government used for the same month in the previous year. Last year, the government adjusted March's rate downward by 0.1 points. The exact adjustment the government uses for March 2014 will not be known until Friday's BLS release.
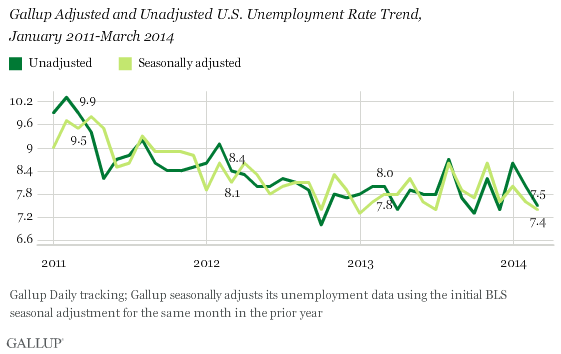
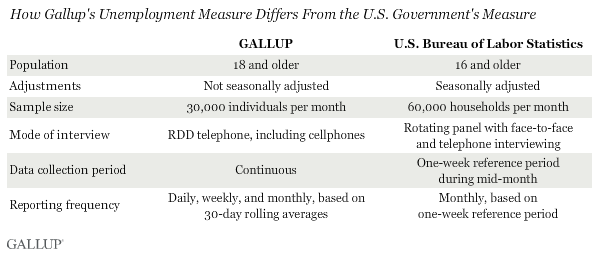
While Gallup and BLS unemployment data are both based on robust surveys, the two have important methodological differences. Gallup's employment numbers generally correlate with BLS rates, although the two will differ from month to month.
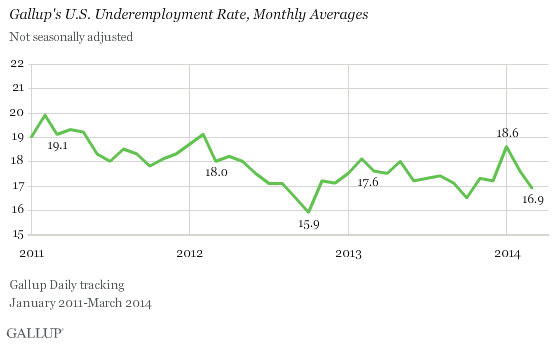
Underemployment, as measured by Gallup without seasonal adjustment, was 16.9% in March. This is down slightly from 17.6% in February and from 17.6% in March 2013. Gallup's U.S. underemployment rate combines the percentage of adults in the workforce who are unemployed (7.5%) with the percentage of those who are working part time but looking for full-time work (9.5%). Due to rounding, the combined underemployment measure is 16.9%, not 17.0%.
Bottom Line
The brief surge in P2P in February has partially ebbed this past March, as P2P again fell below 43%. The percentage of the U.S. adult population employed full time for an employer has generally been lowest in the first quarter of each year since Gallup began tracking it in January 2010, rising in April and peaking in the summer and early fall. Thus, the expectation is that Gallup's P2P measure will rise in the coming months. Still, P2P has been lower this year than in prior years, so even an expected increase in the spring and summer may not bring it back to where it was in 2011, 2012, and 2013.
Gallup.com reports results from these indexes in daily, weekly, and monthly averages and in Gallup.com stories. Complete trend data are always available to view and export in the following charts:
Daily: Employment, Economic Confidence and Job Creation, Consumer Spending
Weekly: Employment, Economic Confidence, Job Creation, Consumer Spending
Read more about Gallup's economic measures.
View our economic release schedule.
Survey Methods
Results for this Gallup poll are based on telephone interviews conducted March 1-31, 2014, on the Gallup Daily tracking survey, with a random sample of 30,401 adults, aged 18 and older, living in all 50 U.S. states and the District of Columbia.
For results based on the total sample of national adults, the margin of sampling error is ±1 percentage points at the 95% confidence level.
Interviews are conducted with respondents on landline telephones and cellular phones, with interviews conducted in Spanish for respondents who are primarily Spanish-speaking. Each sample of national adults includes a minimum quota of 50% cellphone respondents and 50% landline respondents, with additional minimum quotas by time zone within region. Landline and cellular telephone numbers are selected using random-digit-dial methods. Landline respondents are chosen at random within each household on the basis of which member had the most recent birthday.
Samples are weighted to correct for unequal selection probability, nonresponse, and double coverage of landline and cell users in the two sampling frames. They are also weighted to match the national demographics of gender, age, race, Hispanic ethnicity, education, region, population density, and phone status (cellphone only/landline only/both, and cellphone mostly). Demographic weighting targets are based on the most recent Current Population Survey figures for the aged 18 and older U.S. population. Phone status targets are based on the most recent National Health Interview Survey. Population density targets are based on the most recent U.S. census. All reported margins of sampling error include the computed design effects for weighting.
In addition to sampling error, question wording and practical difficulties in conducting surveys can introduce error or bias into the findings of public opinion polls.
For more details on Gallup's polling methodology, visit www.gallup.com.
