PRINCETON, NJ -- The amount Americans reported spending each day in March averaged $87 for the month, identical to February. While spending remains relatively high, this is the first time since the recession that consumers' average daily March spending didn't increase at least slightly over February spending.
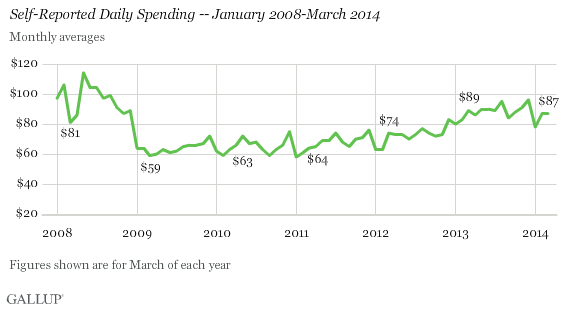
Consumers' March spending was also no higher than their spending a year ago, which averaged $89. By contrast, in line with the U.S. economic recovery, spending had increased each March between 2011 and 2013, rising from $64 in 2011 to $74 in 2012 and $89 in 2013.
These figures are based on Americans' self-reports of the total amount they spent "yesterday" in stores, gas stations, restaurants, or online -- not counting home and vehicle purchases, or normal monthly bills.
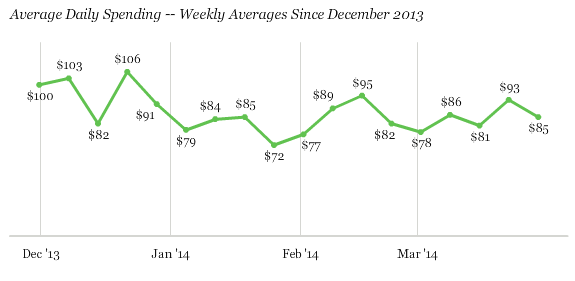
Underscoring the stability in consumer spending last month, the range of Gallup's weekly averages throughout March (from $78 to $93) was generally the same as the range in February (from $77 to $95). And there was no upward trend in March spending that might portend well for April.
Bottom Line
At $87, Americans' average daily spending in March looks positive by comparison to spending over the past five years. But the stall in spending, both month-over-month and compared with a year ago, most likely signals a continuation of the lackluster retail sales seen so far in 2014. Although government figures show that total retail sales, excluding motor vehicles (in line with Gallup's definition of consumer spending), rebounded in February after January's anemic sales, year-over-year sales were up by only 1.6% in January and 1.3% in February -- the weakest retail growth figures since November 2009. Given the Gallup data, it is reasonable to expect that the March report, due April 14, will show more of the same.
Gallup.com reports results from these indexes in daily, weekly, and monthly averages and in Gallup.com stories. Complete trend data are always available to view and export in the following charts:
Daily: Employment, Economic Confidence, Job Creation, Consumer Spending
Weekly: Employment, Economic Confidence, Job Creation, Consumer Spending
Read more about Gallup's economic measures.
View our economic release schedule.
Survey Methods
Results for this Gallup poll are based on telephone interviews conducted March 1-31, 2014, on the Gallup Daily tracking survey, with a random sample of 15,235 adults, aged 18 and older, living in all 50 U.S. states and the District of Columbia.
For results based on the total sample of national adults, the margin of sampling error is ±1 percentage point at the 95% confidence level. The margin of error for the spending mean is ± $4.
Interviews are conducted with respondents on landline telephones and cellular phones, with interviews conducted in Spanish for respondents who are primarily Spanish-speaking. Each sample of national adults includes a minimum quota of 50% cellphone respondents and 50% landline respondents, with additional minimum quotas by time zone within region. Landline and cellular telephone numbers are selected using random-digit-dial methods. Landline respondents are chosen at random within each household on the basis of which member had the most recent birthday.
Samples are weighted to correct for unequal selection probability, nonresponse, and double coverage of landline and cell users in the two sampling frames. They are also weighted to match the national demographics of gender, age, race, Hispanic ethnicity, education, region, population density, and phone status (cellphone only/landline only/both, and cellphone mostly). Demographic weighting targets are based on the most recent Current Population Survey figures for the aged 18 and older U.S. population. Phone status targets are based on the most recent National Health Interview Survey. Population density targets are based on the most recent U.S. census. All reported margins of sampling error include the computed design effects for weighting.
In addition to sampling error, question wording and practical difficulties in conducting surveys can introduce error or bias into the findings of public opinion polls.
For more details on Gallup's polling methodology, visit www.gallup.com.
