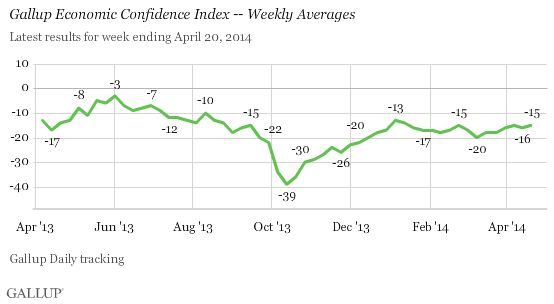
WASHINGTON, D.C. -- Gallup's Economic Confidence Index averaged -15 for the week ending April 20. This is consistent with the previous three weekly readings, which have been either -15 or -16. But it is higher than the -20 recorded in early March, the low point so far for 2014.
Gallup's Economic Confidence Index is the average of two components: Americans' views on the current economic situation and their perception of whether the economy is getting better or worse. This week, 20% of Americans say the economy is "excellent" or "good," and 34% say it is "poor," resulting in a current conditions score of -14. Forty percent of Americans say the economy is getting better, while 55% say it is getting worse. This results in an economic outlook score of -15.
The current weekly index is only a point off from where it was last year, though the weekly readings in 2013 were not as stationary as they have been in 2014. Last April served as a turning point for Americans' views on the economy; May saw the highest readings for the measure on record. After a record high of -3 in May 2013, the weekly index gradually ticked downward through September before dropping sharply to -39 in response to the partial government shutdown in October.
The index showed substantial monthly improvements leading into 2014, but tapered early in the year. Overall, the index has not varied much in 2014, staying within a range of -13 to -20 each week.
Bottom Line
Americans' confidence in the economy has leveled off, showing little positive movement in 2014 after recovering in the latter half of 2013 from the government shutdown.
While scores earlier in 2013 flirted with moving into positive territory, Americans so far this year are consistently negative on where the nation's economy currently stands and whether it is likely to improve. This is not to say confidence won't improve in the weeks to come. The index has shown an increase in the spring months in recent years. This spring could likely see improvement similar to last year, when the seasonal uptick in confidence was higher than usual and reached a record weekly high. Last year's readings, however, weren't as stable as this year's have been, and didn't have the added effect of the lingering consequences of the shutdown.
The good news is that even if the weekly readings continue to lack movement, the month of April will show a slight improvement over February and March. Also, a combination of Americans' increased sense of job creation, a new milestone in Affordable Care Act enrollment, and a shrinking national deficit could all boost overall economic confidence in the coming months.
Gallup.com reports results from these indexes in daily, weekly, and monthly averages and in Gallup.com stories. Complete trend data are always available to view and export in the following charts:
Daily: Economic Confidence
Weekly: Economic Confidence
Read more about Gallup's economic measures.
View our economic release schedule.
Survey Methods
Results for this Gallup poll are based on telephone interviews conducted April 14-20, 2014, on the Gallup Daily tracking survey, with a random sample of 3,040 adults, aged 18 and older, living in all 50 U.S. states and the District of Columbia.
For results based on the total sample of national adults, the margin of sampling error is ±3 percentage points at the 95% confidence level.
Interviews are conducted with respondents on landline telephones and cellular phones, with interviews conducted in Spanish for respondents who are primarily Spanish-speaking. Each sample of national adults includes a minimum quota of 50% cellphone respondents and 50% landline respondents, with additional minimum quotas by time zone within region. Landline and cellular telephone numbers are selected using random-digit-dial methods. Landline respondents are chosen at random within each household on the basis of which member had the most recent birthday.
Samples are weighted to correct for unequal selection probability, nonresponse, and double coverage of landline and cell users in the two sampling frames. They are also weighted to match the national demographics of gender, age, race, Hispanic ethnicity, education, region, population density, and phone status (cellphone only/landline only/both, and cellphone mostly). Demographic weighting targets are based on the most recent Current Population Survey figures for the aged 18 and older U.S. population. Phone status targets are based on the most recent National Health Interview Survey. Population density targets are based on the most recent U.S. census. All reported margins of sampling error include the computed design effects for weighting.
In addition to sampling error, question wording and practical difficulties in conducting surveys can introduce error or bias into the findings of public opinion polls.
For more details on Gallup's polling methodology, visit www.gallup.com.
