PRINCETON, NJ -- The election environment for congressional incumbents in 2014 will be challenging, with several key public opinion indicators as negative or nearly as negative as they have been in any recent midterm election year. This includes congressional job approval, which, at 16%, is on pace to be the lowest in a midterm election year since Gallup first measured it in 1974.
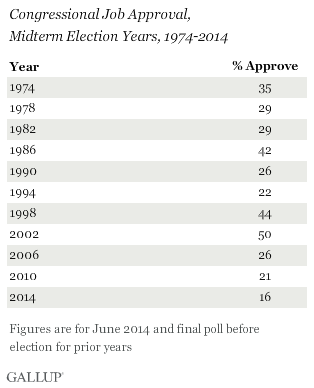
In years when congressional job approval is low, there tends to be greater turnover in House membership. The prior low job approval rating in a midterm election year was 21% in 2010, a year in which 15% of House incumbents seeking re-election were defeated. In 1994, when 22% approved of Congress, 10% of incumbents lost. By comparison, just 4% of incumbents lost in 2002, when Congress enjoyed a 50% approval rating.
The potential vulnerability of congressional incumbents was clear last week, when House Majority Leader Eric Cantor suffered a stunning defeat in his primary election in Virginia, losing to an underfunded GOP "outsider."
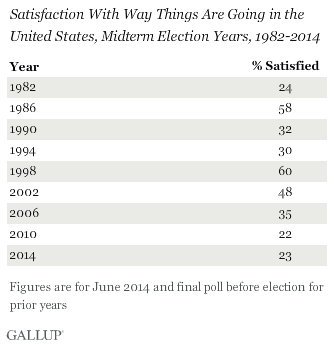
Fewer Than One in Four Satisfied With State of Nation
Americans are not just down on Congress, but also are quite unhappy with the direction of the country more generally. Currently, 23% of Americans are satisfied with the way things are going in the U.S., on par with the 22% satisfaction at the time of the 2010 elections and the 24% before the 1982 elections. Both of those elections saw significant turnover in congressional membership.
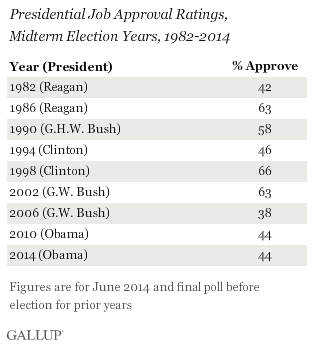
Obama Approval Rating at 2010 Level
Although the president is not a candidate in midterm election years, his standing with voters is usually a significant predictor of election outcomes. When presidents are unpopular, their party typically loses a substantial number of seats in the House of Representatives. Conversely, in the 1998 and 2002 elections, when Presidents Bill Clinton and George W. Bush had approval ratings above 60%, their parties gained House seats, providing rare exceptions to the historical trend of midterm seat losses for the president's party.
President Barack Obama's job approval rating from Gallup Daily tracking has averaged 44% thus far in June. That is the same as his approval rating at the time of the 2010 elections, when Democrats lost more than 60 seats in the House. Only two presidents have had lower job approval ratings in recent midterm elections -- George W. Bush in 2006 and Ronald Reagan in 1982. In those years, the president's party lost more than 20 seats, suggesting seat loss is not always proportional to presidential job approval, but underscoring the peril the president's party faces when his approval rating is below 50%.
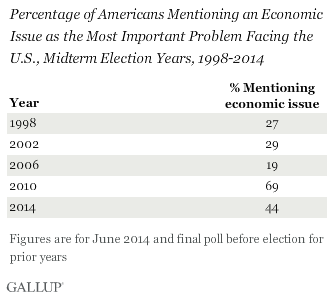
Economic Concern Above Average
Poor economic conditions are often a major reason why Americans are dissatisfied with the state of the nation and disapprove of government leaders. Earlier this year, Gallup found the economy ranking ahead of other issues when voters were asked which will be most important to their vote.
Although Americans' confidence in the economy is improving slightly, the public still shows greater concern over it than in prior midterm election years. Specifically, 44% mention an economic issue when asked to name the most important problem facing the country. That is significantly higher than in the 1998, 2002, and 2006 elections, but is down sharply from 2010, reflecting improvements in the economy since then.
The major aspects of the economy most troubling to Americans are the state of the economy in general and unemployment, mentioned by 20% and 16%, respectively, as the most important problem.
Implications
The political environment in which the 2014 elections are being contested promises to be difficult for congressional incumbents, as public attitudes on key indicators that predict election outcomes are comparatively worse than in prior midterm election years. The likelihood of significant improvement in any of these indicators between now and the fall is fairly low; the dominant trend for congressional approval, presidential approval, and satisfaction is that the measures become more negative by the eve of the midterm elections than they were in January of the same year.
Recently, Gallup found 50% of voters saying their own member of Congress deserves re-election, and 22% saying most members deserve re-election, both among the lowest Gallup has measured. Some members have chosen to retire from Congress rather than seek another term, and others are leaving to run for other offices, which means there will already be a significant change in membership in the next Congress regardless of what voters do in the fall. But voters may be poised to send even more incumbents home. Although every House election is based on idiosyncratic local personalities and factors, Cantor's defeat last Tuesday can serve as a pointed reminder for incumbents seeking re-election of just how vulnerable they may be this year.
Survey Methods
Results for this Gallup poll are based on telephone interviews conducted June 5-8, 2014, with a random sample of 1,027 adults, aged 18 and older, living in all 50 U.S. states and the District of Columbia.
For results based on the total sample of national adults, the margin of sampling error is ±4 percentage points at the 95% confidence level.
Interviews are conducted with respondents on landline telephones and cellular phones, with interviews conducted in Spanish for respondents who are primarily Spanish-speaking. Each sample of national adults includes a minimum quota of 50% cellphone respondents and 50% landline respondents, with additional minimum quotas by time zone within region. Landline and cellular telephone numbers are selected using random-digit-dial methods. Landline respondents are chosen at random within each household on the basis of which member had the most recent birthday.
Samples are weighted to correct for unequal selection probability, nonresponse, and double coverage of landline and cell users in the two sampling frames. They are also weighted to match the national demographics of gender, age, race, Hispanic ethnicity, education, region, population density, and phone status (cellphone only/landline only/both, and cellphone mostly). Demographic weighting targets are based on the most recent Current Population Survey figures for the aged 18 and older U.S. population. Phone status targets are based on the most recent National Health Interview Survey. Population density targets are based on the most recent U.S. census. All reported margins of sampling error include the computed design effects for weighting.
In addition to sampling error, question wording and practical difficulties in conducting surveys can introduce error or bias into the findings of public opinion polls.
View survey methodology, complete question responses, and trends.
For more details on Gallup's polling methodology, visit www.gallup.com.