PRINCETON, NJ -- Sixty-six percent of Americans in the first half of June are satisfied with the way the healthcare system is working for them, in line with attitudes since mid-March. Gallup's seven-day rolling average on this measure shows confidence during that time has varied only slightly, increasing to 70% in mid-April, just after the enrollment period ended for purchasing insurance under the provisions of the Affordable Care Act. That modest increase was short-lived; satisfaction has averaged about 65% since mid-May.
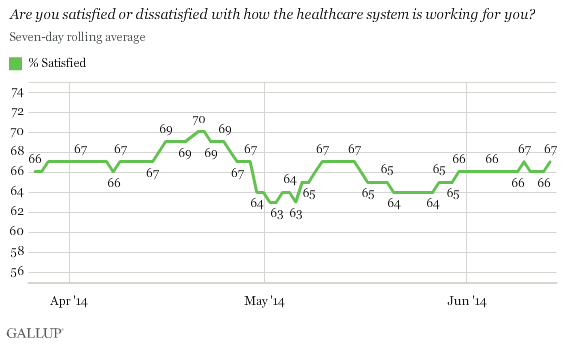
Gallup began asking this question nightly on March 21 as a continuous measure of the way changes in the nation's healthcare system are affecting average Americans. There are no comparable data for 2013 or previous years, before the ACA's individual insurance mandate helped lead to a significant drop in the uninsured population in the U.S. However, these readings serve as a baseline for assessing the effect the ACA is having on people's healthcare experiences as they interact with the system going forward.
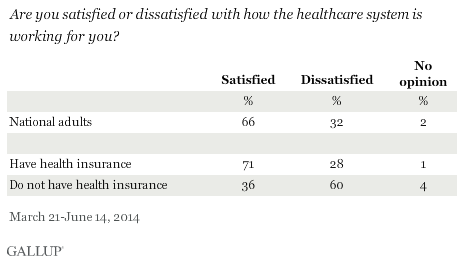
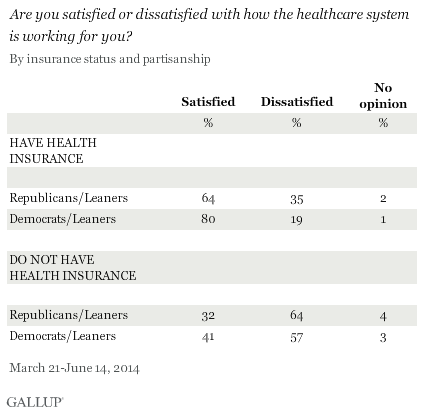
Americans' satisfaction with the healthcare system is highly related to their health insurance status, although having health insurance does not guarantee satisfaction. Nearly three in 10 Americans with insurance say they are dissatisfied with the way the healthcare system is working for them. Among those without insurance -- currently about 13.4% of Americans -- six in 10 are dissatisfied.
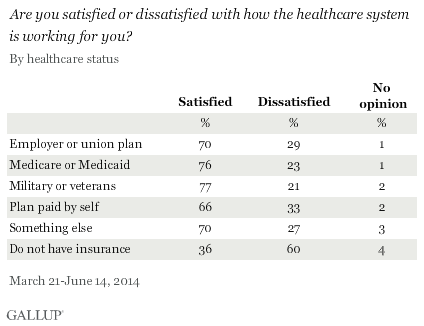
Higher percentages of Americans aged 65 and older are satisfied (79%) with how the system is working, with satisfaction ranging from 61% to 66% among those between the ages of 18 and 49. This elevated level of satisfaction among older Americans reflects that most in this group are covered by Medicare. Along these same lines, slightly higher-than-average proportions of individuals who have government-paid insurance -- including not only Medicare, but Medicaid and military or veterans insurance -- are satisfied with the way the healthcare system is treating them.
Politics Have an Effect Above and Beyond Insurance Status
This measure of healthcare satisfaction does not mention the ACA or any other details about what the U.S. healthcare system entails, and is, effectively, politically neutral. Still, politics shade the results, with Democrats and Democratic-leaning independents somewhat more likely to say they are satisfied than are Republicans and Republican leaners.
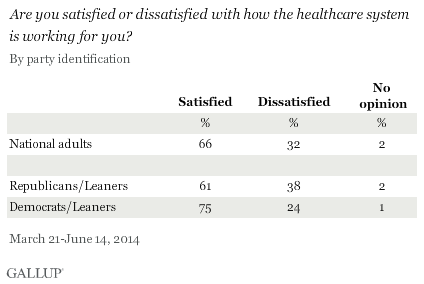
While health insurance status is clearly the most significant predictor of satisfaction, partisan identification still has an effect beyond basic insurance status. There is a 16-point satisfaction gap between Republicans and Democrats among those with health insurance, and a nine-point gap among those without it.
Implications
About 13% of the U.S. adult population remains uninsured at this point, even after the institution of the ACA's individual mandate and the availability of insurance through government health exchanges. These uninsured Americans are half as likely as those with insurance to say they are satisfied with the way the healthcare system is working for them. Still, one in three Americans without insurance are satisfied, and almost as many of those with insurance are dissatisfied, indicating that there is more involved in satisfaction than having insurance.
More Americans with government-paid insurance are satisfied with the way the system is working than is true for those with private plans. The data do not provide a way of separating out those newly insured through the exchanges. These individuals are just now beginning to see how well these plans work in their personal situations, and all of them will need to re-enroll when the exchanges open up again in mid-November. This ongoing measure of Americans' healthcare satisfaction will provide an assessment of any effect of these changes going forward.
Americans' high level of satisfaction with how the healthcare system is treating them suggests that healthcare is not in a crisis for most Americans. At the same time, that 30% of the adult population -- more than 70 million people -- is not satisfied with the healthcare system underscores the need for improvement.
Some Americans who are dissatisfied with the way the healthcare system is treating them may be expressing their displeasure with particular doctors, hospitals, billing issues, or medical procedures -- aspects that have little to do with the broader issue of how healthcare coverage is provided. The differing satisfaction levels between those with insurance and those without, and between those with federal and those with private plans, however, indicate that the way this coverage is provided is obviously related to healthcare satisfaction.
Survey Methods
Results for this Gallup poll are based on telephone interviews conducted March 21-June 14, 2014, with a random sample of 42,566 adults, aged 18 and older, living in all 50 U.S. states and the District of Columbia.
For results based on the total sample of national adults, the margin of sampling error is ±1 percentage point at the 95% confidence level.
Interviews are conducted with respondents on landline telephones and cellular phones, with interviews conducted in Spanish for respondents who are primarily Spanish-speaking. Each sample of national adults includes a minimum quota of 50% cellphone respondents and 50% landline respondents, with additional minimum quotas by time zone within region. Landline and cellular telephone numbers are selected using random-digit-dial methods. Landline respondents are chosen at random within each household on the basis of which member had the most recent birthday.
Samples are weighted to correct for unequal selection probability, nonresponse, and double coverage of landline and cell users in the two sampling frames. They are also weighted to match the national demographics of gender, age, race, Hispanic ethnicity, education, region, population density, and phone status (cellphone only/landline only/both, and cellphone mostly). Demographic weighting targets are based on the most recent Current Population Survey figures for the aged 18 and older U.S. population. Phone status targets are based on the most recent National Health Interview Survey. Population density targets are based on the most recent U.S. census. All reported margins of sampling error include the computed design effects for weighting.
In addition to sampling error, question wording and practical difficulties in conducting surveys can introduce error or bias into the findings of public opinion polls.
For more details on Gallup's polling methodology, visit www.gallup.com.