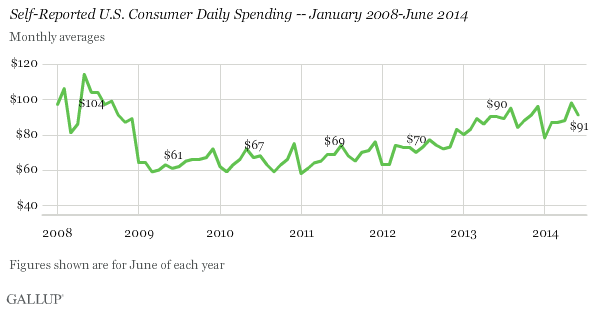
WASHINGTON, D.C. -- Americans' self-reports of daily spending fell back slightly in June, averaging $91 for the month. This is down slightly from a six-year high of $98 in May, but is similar to the $90 average found in June 2013.
These figures are based on Gallup Daily tracking interviews throughout June with more than 15,000 Americans. The poll asks Americans to report the total amount they spent "yesterday" in stores, gas stations, restaurants, or online -- not counting home and vehicle purchases, or normal monthly bills -- and gives an indication of discretionary spending.
This $91 figure for June suggests a mixed bag for the economy. While it represents a much higher level of consumer spending than the $60 to $70 averages found for much of 2009 to 2012, it also represents the first decline in the monthly average since January of this year.
While Americans' self-reported spending in June was generally on par or lower than their average May spending, this month's $7 drop is one of the largest recorded by Gallup during this time of year since 2008, when June spending fell by $10. The June 2008 spending average of $104 is still the highest average for that month in Gallup's six-year trend.
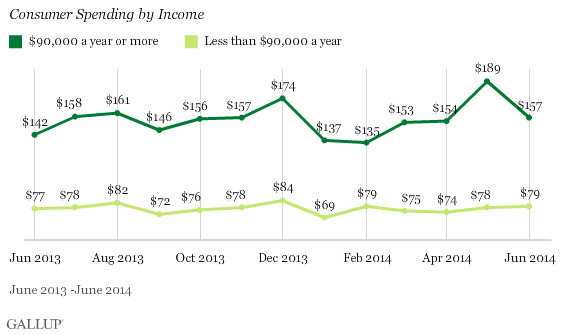
Spending Among Upper-Income Americans Back to April Average
The drop in daily spending among all Americans can largely be attributed to upper-income Americans spending less in June. Americans living in households with $90,000 a year or more in income reported spending on average $189 a day in May, but this dropped to $157 in June, similar to this group's average spending in April. On the other hand, reported spending among middle- and lower-income Americans, households with incomes of less than $90,000 a year, was steady in June. Spending among this group has been roughly the same each month since January.
Bottom Line
Americans' average daily spending dropped in June from May's levels. This indicator fits in the context of scores on Gallup's other economic measures. Job creation remained flat, although maintaining May's six-year high. Economic confidence dipped slightly from May, but remains higher than the economic confidence found several years ago in the depth of the recession. And, importantly, the U.S. Payroll to Population rate continued its recent monthly rise, indicating that more U.S. adults have full-time work.
That self-reported spending did not increase in June is important, given that consumer expenditures are a significant driver of the U.S. economy. While Americans are spending more than they did several years ago, spending has not returned to pre-recession levels. It may take more time before the recent encouraging improvements in the labor market and economic confidence lead to further increases in consumers' spending.
Gallup.com reports results from these indexes in daily, weekly, and monthly averages and in Gallup.com stories. Complete trend data are always available to view and export in the following charts:
Daily: Employment, Economic Confidence and Job Creation, Consumer Spending
Weekly: Employment, Economic Confidence, Job Creation, Consumer Spending
Read more about Gallup's economic measures.
View our economic release schedule.
Survey Methods
Results for this Gallup poll are based on telephone interviews conducted June 1-30, 2014, on the Gallup Daily tracking survey, with a random sample of 14,696 adults, aged 18 and older, living in all 50 U.S. states and the District of Columbia.
For results based on the total sample of national adults, the margin of sampling error is ±1 percentage points at the 95% confidence level. The margin of error for the spending mean is +/-$5.
Interviews are conducted with respondents on landline telephones and cellular phones, with interviews conducted in Spanish for respondents who are primarily Spanish-speaking. Each sample of national adults includes a minimum quota of 50% cellphone respondents and 50% landline respondents, with additional minimum quotas by time zone within region. Landline and cellular telephone numbers are selected using random-digit-dial methods. Landline respondents are chosen at random within each household on the basis of which member had the most recent birthday.
Samples are weighted to correct for unequal selection probability, nonresponse, and double coverage of landline and cell users in the two sampling frames. They are also weighted to match the national demographics of gender, age, race, Hispanic ethnicity, education, region, population density, and phone status (cellphone only/landline only/both, and cellphone mostly). Demographic weighting targets are based on the most recent Current Population Survey figures for the aged 18 and older U.S. population. Phone status targets are based on the most recent National Health Interview Survey. Population density targets are based on the most recent U.S. census. All reported margins of sampling error include the computed design effects for weighting.
In addition to sampling error, question wording and practical difficulties in conducting surveys can introduce error or bias into the findings of public opinion polls.
For more details on Gallup's polling methodology, visit www.gallup.com.