PRINCETON, NJ -- Even as overall party identification trends in the U.S. have shifted over the past six and half years, the relationship between religion and party identification has remained consistent. Very religious Americans are more likely to identify with or lean toward the Republican Party and less frequently identify with or lean toward the Democratic Party, compared with those who are moderately or nonreligious.
Gallup classifies Americans as "very religious" if they say religion is an important part of their daily lives and that they attend religious services every week or almost every week. That group constituted 41% of all U.S. adults in the first half of 2014. "Nonreligious" Americans (30% of Americans in 2014) are those who say religion is not an important part of their daily lives and that they seldom or never attend religious services. The remaining group, 29%, are classified as "moderately religious." These people say religion is important in their lives but that they do not attend services regularly, or that religion is not important but that they still attend services.
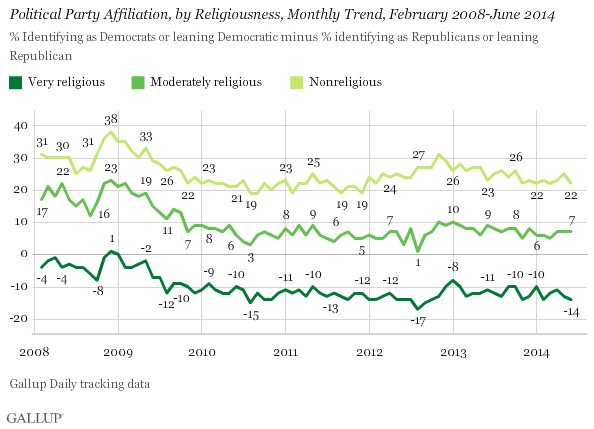
From 2008 to June 2014, nonreligious Americans have been the most Democratic of the three religious groups, with a net Democratic value ranging between +38 and +19 over that period. Those who are moderately religious have also tilted Democratic, with net values ranging from +23 to +1. Those who are very religious are least Democratic, with net values in the negative range, meaning that on average, this group identifies with or leans toward the Republican Party more than the Democratic Party.
All three groups were more Democratic and less Republican in 2008 and early 2009, reflecting the generally more Democratic tilt of the country at that time, but the differences among those who are very, moderately, or nonreligious were as significant then as they are now. In short, the religious gap in party identification has persisted over nearly seven years.
These data are based on Gallup Daily tracking samples of approximately 30,000 interviews per month from 2008 to 2012, and 15,000 per month in 2013 to 2014.
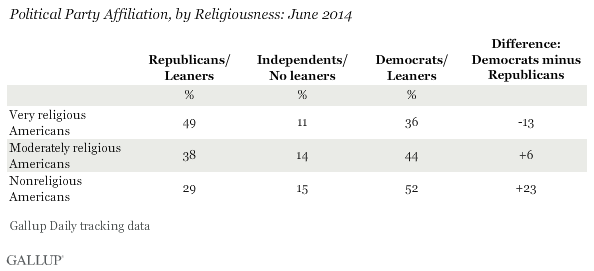
About Half of Very Religious Americans Are Republicans
Data from the first six months of 2014 provide more detailed insights into the underlying relationship between religiousness and partisanship. Republican identification (including leaners) drops from 49% to 29% among those who are very religious versus those who are unreligious, respectively, while Democratic identification rises from 36% to 52% between these two groups.
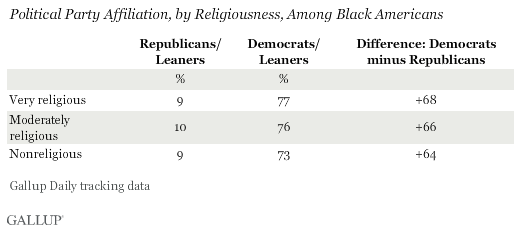
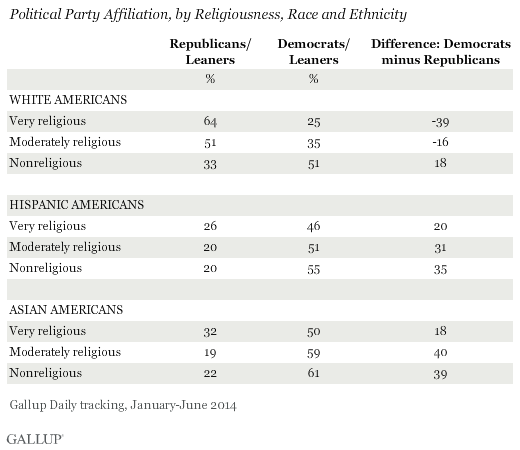
Black Democratic Partisanship Unaffected by Religiousness
The relationship between religiosity and party identification in the U.S. has been both constant across time and most demographic groups within the population, including age, gender, region, and socio-economic status. Within each category of these groups, Americans who are the most religious are the most likely to be Republican, while those who are the least religious are the most likely to be Democratic.
The one exception to the basic religiousness and party identification relationship occurs among black Americans, who tend to be the most Democratic of any major race and ethnic group measured. Blacks are very religious on average, but the political orientation of blacks who are nonreligious does not vary significantly from those who are very religious. Democratic affiliation among black Americans hovers near 75% within all three religious groups of black Americans.
On the other hand, non-Hispanic whites, Hispanics, and Asians follow the basic pattern observed in the general population, with more religious members of each group skewing more Republican. The relationship is most pronounced among non-Hispanic whites, among whom the swing in the net Democratic advantage goes from +18 points among those who are unreligious to -39 points among those who are very religious.
Very religious Hispanics and very religious Asians are also significantly less likely to identify with or lean toward the Democratic Party than those in each group who are less religious. Americans in both of these groups show a Democratic preference overall, but that preference is significantly less pronounced among very religious Hispanics and Asians than among the others.
Bottom Line
The relationship between Americans' religiousness and their party preference is a persistent and well-documented social pattern that has remained extraordinarily stable over the last six and a half years. The basic nature of the relationship -- in which those who are the most religious are the most likely to identify as Republicans -- has changed little. With few exceptions, Americans' religiousness remains a major predictor of their political orientation.
The underlying explanations for the relationship are complex, and have to do with the historical development of partisan politics in the decades since Jimmy Carter and Ronald Reagan were president, differing positions of the parties on moral and values issues such as abortion and same-sex marriage, and geographic patterns of residency that are simultaneously related to religiousness and partisanship.
From a practical politics standpoint, Republicans face the challenge of expanding their party's appeal beyond the minority of Americans who are very religious, and appealing to Hispanics and Asians given that even the most religious of these growing groups tilt Democratic, albeit not as much as others in these groups who are less religious. Democrats face the challenge of attempting to broaden their party's appeal beyond the base of those who are moderately or nonreligious, a tactic that most likely will require effort to frame the party's positions on social justice and equality issues in a way that is compatible with a high degree of religiousness.
Survey Methods
Results for this Gallup poll are based on telephone interviews conducted from January 2008 through June 2014 on the Gallup Daily tracking survey, with monthly random samples of between 15,000 and 30,000 national adults, aged 18 and older, living in all 50 U.S. states and the District of Columbia.
For results based on the total sample of 87,023 national adults interviewed January-June 2014, the margin of sampling error is ±1 percentage point at the 95% confidence level.
Interviews are conducted with respondents on landline telephones and cellular phones, with interviews conducted in Spanish for respondents who are primarily Spanish-speaking. Each sample of national adults includes a minimum quota of 50% cellphone respondents and 50% landline respondents, with additional minimum quotas by time zone within region. Landline and cellular telephone numbers are selected using random-digit-dial methods. Landline respondents are chosen at random within each household on the basis of which member had the most recent birthday.
Samples are weighted to correct for unequal selection probability, nonresponse, and double coverage of landline and cell users in the two sampling frames. They are also weighted to match the national demographics of gender, age, race, Hispanic ethnicity, education, region, population density, and phone status (cellphone only/landline only/both, and cellphone mostly). Demographic weighting targets are based on the most recent Current Population Survey figures for the aged 18 and older U.S. population. Phone status targets are based on the most recent National Health Interview Survey. Population density targets are based on the most recent U.S. census. All reported margins of sampling error include the computed design effects for weighting.
In addition to sampling error, question wording and practical difficulties in conducting surveys can introduce error or bias into the findings of public opinion polls.
For more details on Gallup's polling methodology, visit www.gallup.com.