WASHINGTON, D.C. -- Gallup's Economic Confidence Index fell two points in July to -17, which is the lowest index reading since March.
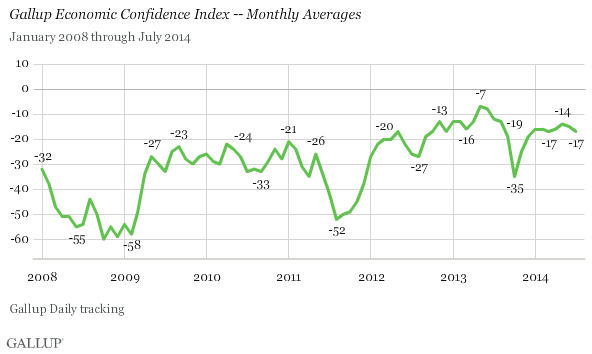
Despite small monthly ups and downs, U.S. economic confidence has generally been quite stable so far in 2014, with monthly index averages ranging between -14 and -17. By contrast, at the end of 2013, confidence plunged 16 points in October during the federal government shutdown, followed by a 10-point increase in November after the shutdown ended.
Economic confidence was -15 for the week of July 28 through Aug. 3, slightly better than the July average. It also marked a sharp improvement from the -21 score the week prior -- the lowest economic confidence reading in any week this year. The rapid recovery last week suggests a short-term downtick, rather than lasting change. Americans' confidence in the economy improved last week despite sharp drops in the major stock market indexes.
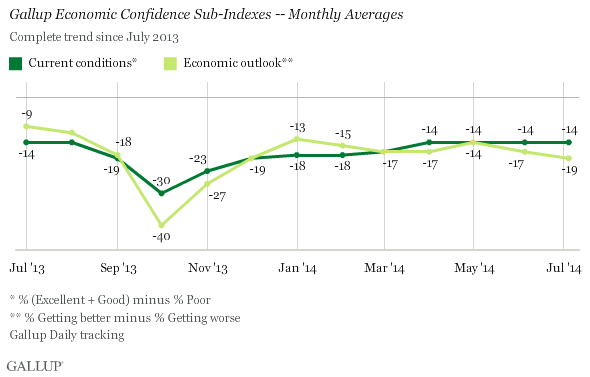
Gallup's Economic Confidence Index is the average of two components, Americans' ratings of current economic conditions in the nation, and their perceptions of whether the economy is getting better or getting worse. In July, 20% of Americans said current economic conditions were "excellent" or "good" while 34% said they were "poor," resulting in a -14 net current conditions score. Americans' views of current economic conditions have been unchanged since April.
Meanwhile, 38% of Americans last month said the economy is getting better while 57% said it is getting worse. This results in a net economic outlook score of -19, the lowest score since last December. Thus, the drop in overall U.S. economic confidence in July was the result of souring views of the economy's direction rather than changing assessments of current conditions.
Middle- and Lower-Income Americans' Confidence Dropped in July
The Economic Confidence Index among upper-income Americans was -5 in July, the same as in June. However, the index among middle- and lower-income Americans was -19, a two-point drop from June.
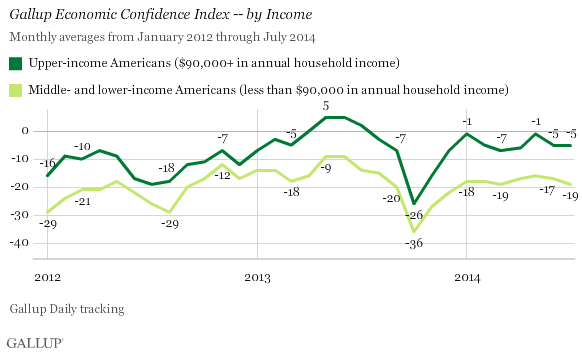
Prior to July, Americans across income groups had similar month-to-month variations in economic confidence. Because more Americans live in households with less than $90,000 in annual income, the drop in confidence last month among this group drove down the overall index.
Americans earning $90,000 or more in annual household income have generally been more confident in the economy than Americans with less household income since Gallup began measuring economic confidence daily in 2008.
Implications
The July dip in economic confidence reflects a dimming of Americans' confidence in the economy's direction, even as their views of current conditions remained steady.
The drop in the index last month was partly a function of the sharply lower confidence for the week of July 21-27 -- a time when the stock market stumbled and a number of international events may have rattled Americans' outlook. Confidence bounced back in the last few days of July and first few days of August, despite drops in the stock market. This increase in economic confidence is perhaps because of generally positive reports on the nation's gross domestic product and job growth.
Gallup.com reports results from these indexes in daily, weekly, and monthly averages and in Gallup.com stories. Complete trend data are always available to view and export in the following charts:
Daily: Employment, Economic Confidence, Job Creation, Consumer Spending
Weekly: Employment, Economic Confidence, Job Creation, Consumer Spending
Read more about Gallup's economic measures.
View our economic release schedule.
Survey Methods
Results for this Gallup poll are based on telephone interviews conducted July 1-31, 2014, on the Gallup Daily tracking survey, with a random sample of 15,193 adults, aged 18 and older, living in all 50 U.S. states and the District of Columbia.
For results based on the total sample of national adults, the margin of sampling error is ±1 percentage point at the 95% confidence level.
Interviews are conducted with respondents on landline telephones and cellular phones, with interviews conducted in Spanish for respondents who are primarily Spanish-speaking. Each sample of national adults includes a minimum quota of 50% cellphone respondents and 50% landline respondents, with additional minimum quotas by time zone within region. Landline and cellular telephone numbers are selected using random-digit-dial methods. Landline respondents are chosen at random within each household on the basis of which member had the most recent birthday.
Samples are weighted to correct for unequal selection probability, nonresponse, and double coverage of landline and cell users in the two sampling frames. They are also weighted to match the national demographics of gender, age, race, Hispanic ethnicity, education, region, population density, and phone status (cellphone only/landline only/both, and cellphone mostly). Demographic weighting targets are based on the most recent Current Population Survey figures for the aged 18 and older U.S. population. Phone status targets are based on the most recent National Health Interview Survey. Population density targets are based on the most recent U.S. census. All reported margins of sampling error include the computed design effects for weighting.
In addition to sampling error, question wording and practical difficulties in conducting surveys can introduce error or bias into the findings of public opinion polls.
For more details on Gallup's polling methodology, visit www.gallup.com.
