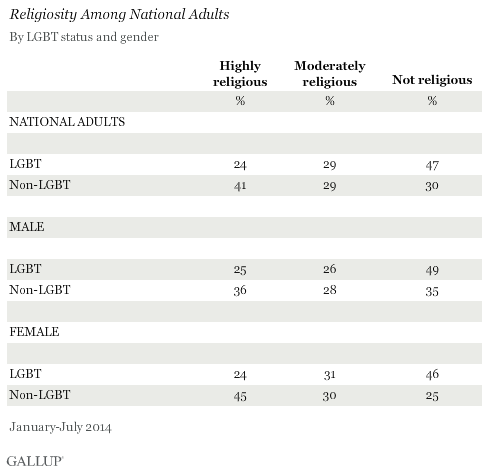
PRINCETON, NJ -- Americans who identify as lesbian, gay, bisexual, or transgender are significantly less likely than non-LGBT Americans to be highly religious, and significantly more likely to be classified as not religious. The same percentage of each group is moderately religious.
These results are based on more than 104,000 Gallup Daily tracking interviews conducted between Jan. 2 and July 31, 2014, including 3,242 adults who identified themselves as lesbian, gay, bisexual, or transgender.
Gallup classifies Americans as "very religious" if they say religion is an important part of their daily lives and that they attend religious services every week or almost every week. That group constituted 41% of all U.S. adults between January and July 2014. "Nonreligious" Americans (30% of U.S. adults) are those who say religion is not an important part of their daily lives and that they seldom or never attend religious services. The remaining group, 29% of Americans, are classified as "moderately religious." These people say religion is important in their lives but that they do not attend services regularly, or that religion is not important but that they still attend services.
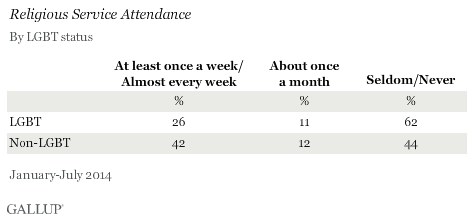
LGBT and non-LGBT individuals differ on both dimensions that make up the religiosity classification. About a quarter of LGBT individuals attend religious services regularly, contrasted with 42% of non-LGBT individuals.
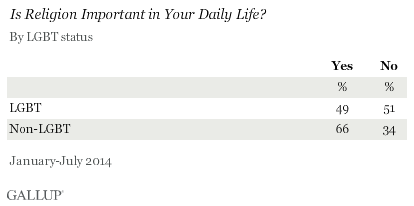
In similar fashion, although about half of LGBT individuals say religion is important in their daily lives, this is significantly less than the 66% of non-LGBT individuals who say religion is important.
There are a number of possible explanations for the lower level of religiosity among the U.S. LGBT population. LGBT individuals may feel less welcome in many congregations whose church doctrine, church policy, or ministers or parishioners condemn same-sex relations, and for the same reasons may be less likely to adopt religion into their own daily lives and beliefs.
Other possible explanations have to do less with church doctrine and more with the demographics of the LGBT population. LGBT individuals may be more likely to live in areas and cities where religion and religious service attendance are less common, and may adopt the practices of those with whom they share geography.
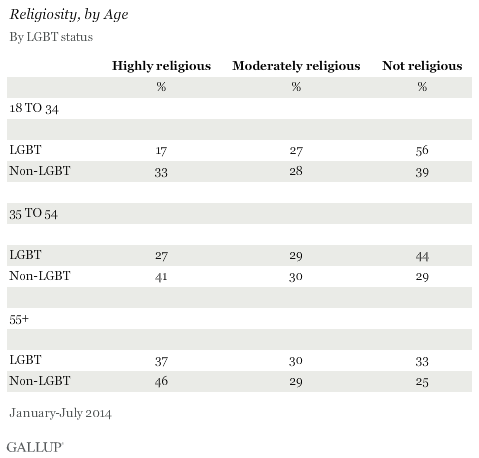
The LGBT population skews substantially younger than the non-LGBT population, and because younger people are the least religious of any age group in the U.S. today, age could be an explanation. However, a look at the relationship between LGBT status and religiousness across age groups shows that while older individuals in both groups are more religious than those who are younger, differences in religiousness are evident within all three age groups. In short, even if the LGBT population had the same age divisions as the non-LGBT population, the former's lower levels of religiousness would most likely still be evident.
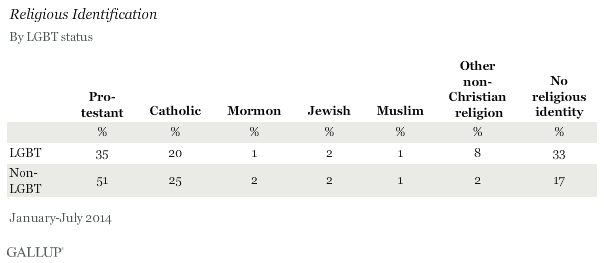
LGBT Americans More Likely to Be "Nones," Less Likely to Be Protestants or Catholics
Overall, 67% of LGBT Americans identify with a specific or general religion, lower than the 83% of non-LGBT adults who identify with one -- with fewer LGBT individuals identifying as Protestants, and, to a lesser degree, as Catholics. While slightly more than half of the non-LGBT population is Protestant, that percentage shrinks to 35% among the LGBT population. The LGBT Catholic percentage is five points lower than the non-LGBT group. LGBT individuals are as likely as others to identify as Jews or Muslims, while they are more likely to identify with all other non-Christian religions combined -- 8% vs. 2%.
Bottom Line
The under-representation of LGBT Americans in the ranks of the religious in the U.S. today has a number of possible causes. Some of these center on the effect of church policies and doctrine, which have historically been disapproving of non-heterosexual love and relations, while others may reflect demographic and geographic differences in the LGBT population compared with the rest of the population.
Societal attitudes toward same-sex relations have become more accepting, and recent stances taken by several churches and religions reflect this. Just this summer, the Presbyterian Church (USA) voted to allow that denomination's ministers to perform same-sex marriages in states where it is legal. If these types of shifts continue, LGBT adults may be more likely to feel welcome in attending churches and other religious institutions, as well as in identifying as religious, personally.
Survey Methods
Results for this Gallup poll are based on telephone interviews conducted January to July 2014, on the Gallup Daily tracking survey, with a random sample of 104,024 adults, aged 18 and older, living in all 50 U.S. states and the District of Columbia. For results based on the total sample of national adults, the margin of sampling error is ±1 percentage point at the 95% confidence level.
For results based on the total sample of 3,242 LGBT adults, the margin of sampling error is ±2 percentage points at the 95% confidence level.
For results based on the total sample of 93,324 non-LGBT adults, the margin of sampling error is ±1 percentage point at the 95% confidence level.
Interviews are conducted with respondents on landline telephones and cellular phones, with interviews conducted in Spanish for respondents who are primarily Spanish-speaking. Each sample of national adults includes a minimum quota of 50% cellphone respondents and 50% landline respondents, with additional minimum quotas by time zone within region. Landline and cellular telephone numbers are selected using random-digit-dial methods. Landline respondents are chosen at random within each household on the basis of which member had the most recent birthday.
Samples are weighted to correct for unequal selection probability, nonresponse, and double coverage of landline and cell users in the two sampling frames. They are also weighted to match the national demographics of gender, age, race, Hispanic ethnicity, education, region, population density, and phone status (cellphone only/landline only/both, and cellphone mostly). Demographic weighting targets are based on the most recent Current Population Survey figures for the aged 18 and older U.S. population. Phone status targets are based on the most recent National Health Interview Survey. Population density targets are based on the most recent U.S. census. All reported margins of sampling error include the computed design effects for weighting.
In addition to sampling error, question wording and practical difficulties in conducting surveys can introduce error or bias into the findings of public opinion polls.
For more details on Gallup's polling methodology, visit www.gallup.com.